Microsoft PL-300 Exam Practice Questions (P. 5)
- Full Access (408 questions)
- One Year of Premium Access
- Access to one million comments
- Seamless ChatGPT Integration
- Ability to download PDF files
- Anki Flashcard files for revision
- No Captcha & No AdSense
- Advanced Exam Configuration
Question #41
HOTSPOT -
You have a Power BI report.
You have the following tables.
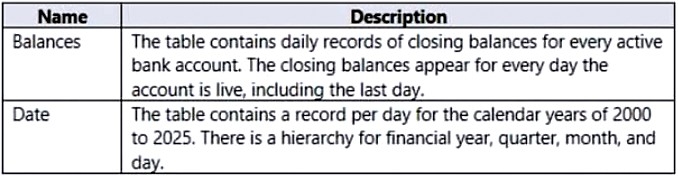
You have the following DAX measure.
Accounts :=
CALCULATE (
DISTINCTCOUNT (Balances[AccountID]),
LASTDATE ('Date'[Date])
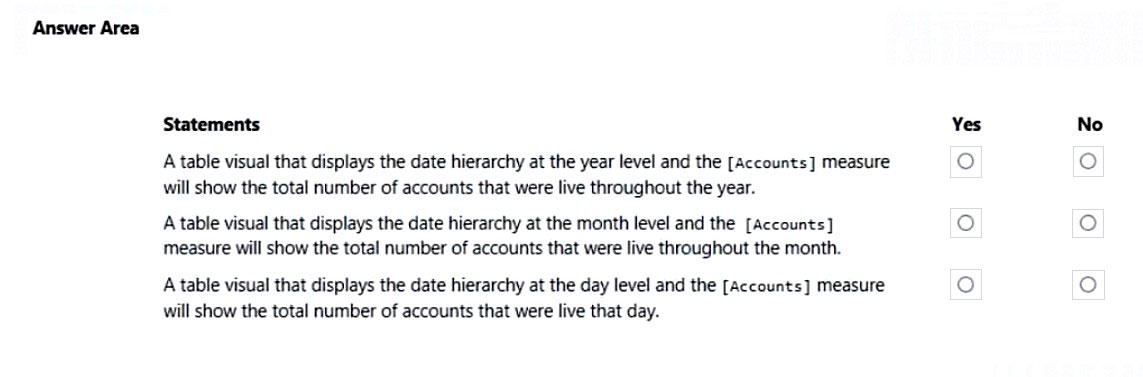
For each of the following statements, select Yes if the statement is true. Otherwise, select No.
NOTE: Each correct selection is worth one point.
Hot Area:
You have a Power BI report.
You have the following tables.
You have the following DAX measure.
Accounts :=
CALCULATE (
DISTINCTCOUNT (Balances[AccountID]),
LASTDATE ('Date'[Date])
For each of the following statements, select Yes if the statement is true. Otherwise, select No.
NOTE: Each correct selection is worth one point.
Hot Area:
Correct Answer:
Box 1: No -
It will show the total number of accounts that were live at the last day of the year only.
Note:
DISTINCTCOUNT counts the number of distinct values in a column.
LASTDATE returns the last date in the current context for the specified column of dates.
Box 2: No -
It will show the total number of accounts that were live at the last day of the month only.
Box 3: Yes -
Reference:
https://docs.microsoft.com/en-us/dax/distinctcount-function-dax https://docs.microsoft.com/en-us/dax/lastdate-function-dax
Question #42
You have the tables shown in the following table.
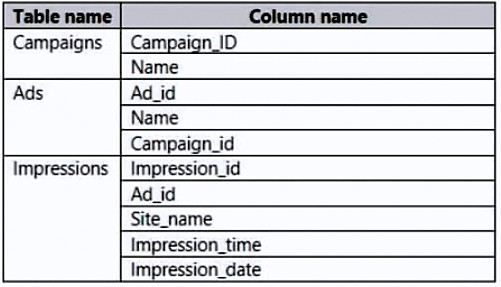
The Impressions table contains approximately 30 million records per month.
You need to create an ad analytics system to meet the following requirements:
✑ Present ad impression counts for the day, campaign, and site_name. The analytics for the last year are required.
Minimize the data model size.

Which two actions should you perform? Each correct answer presents part of the solution.
NOTE: Each correct selection is worth one point.
The Impressions table contains approximately 30 million records per month.
You need to create an ad analytics system to meet the following requirements:
✑ Present ad impression counts for the day, campaign, and site_name. The analytics for the last year are required.
Minimize the data model size.
Which two actions should you perform? Each correct answer presents part of the solution.
NOTE: Each correct selection is worth one point.
Question #43
HOTSPOT -
You are creating a Microsoft Power BI data model that has the tables shown in the following table.
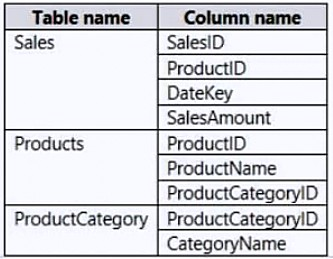
The Products table is related to the ProductCategory table through the ProductCategoryID column. Each product has one product category.
You need to ensure that you can analyze sales by product category.
How should you configure the relationship from ProductCategory to Products? To answer, select the appropriate options in the answer area.
NOTE: Each correct selection is worth one point.
Hot Area:
You are creating a Microsoft Power BI data model that has the tables shown in the following table.
The Products table is related to the ProductCategory table through the ProductCategoryID column. Each product has one product category.
You need to ensure that you can analyze sales by product category.
How should you configure the relationship from ProductCategory to Products? To answer, select the appropriate options in the answer area.
NOTE: Each correct selection is worth one point.
Hot Area:
Correct Answer:

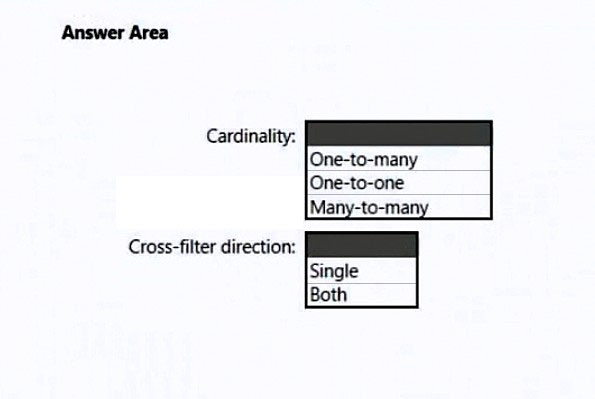
Box 1: One-to-many -
The one-to-many and many-to-one cardinality options are essentially the same, and they're also the most common cardinality types.
Incorrect: A many-to-many relationship means both columns can contain duplicate values. This cardinality type is infrequently used. It's typically useful when designing complex model requirements. You can use it to relate many-to-many facts or to relate higher grain facts. For example, when sales target facts are stored at product category level and the product dimension table is stored at product level.
Box 2: Single -
Incorrect:
Bear in mind that bi-directional relationships can impact negatively on performance. Further, attempting to configure a bi-directional relationship could result in ambiguous filter propagation paths. In this case, Power BI Desktop may fail to commit the relationship change and will alert you with an error message.
Reference:
https://docs.microsoft.com/en-us/power-bi/transform-model/desktop-relationships-understand
Question #44
You import a Power BI dataset that contains the following tables:
✑ Date
✑ Product
✑ Product Inventory
The Product Inventory table contains 25 million rows. A sample of the data is shown in the following table.
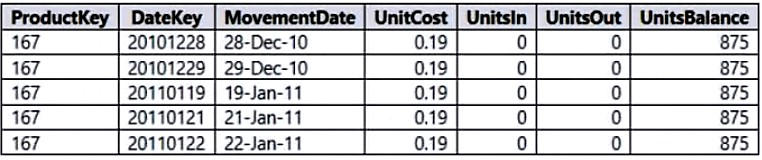
The Product Inventory table relates to the Date table by using the DateKey column. The Product Inventory table relates to the Product table by using the
ProductKey column.
You need to reduce the size of the data model without losing information.
What should you do?
✑ Date
✑ Product
✑ Product Inventory
The Product Inventory table contains 25 million rows. A sample of the data is shown in the following table.
The Product Inventory table relates to the Date table by using the DateKey column. The Product Inventory table relates to the Product table by using the
ProductKey column.
You need to reduce the size of the data model without losing information.
What should you do?
Question #45
HOTSPOT -
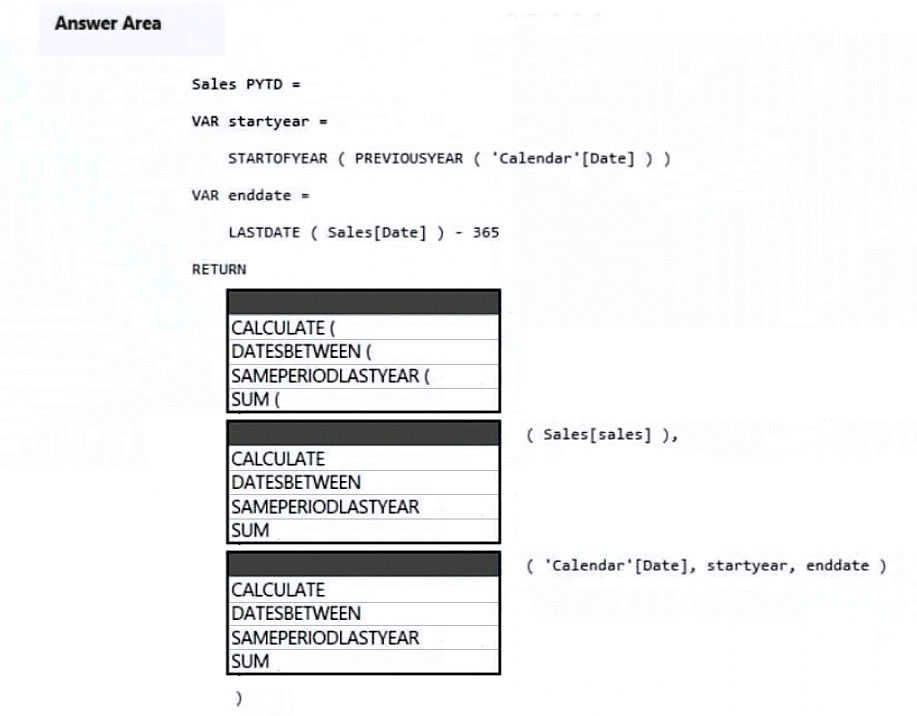
You are enhancing a Power BI model that has DAX calculations.
You need to create a measure that returns the year-to-date total sales from the same date of the previous calendar year.
Which DAX functions should you use? To answer, select the appropriate options in the answer area.
NOTE: Each correct selection is worth one point.
Hot Area:
Correct Answer:
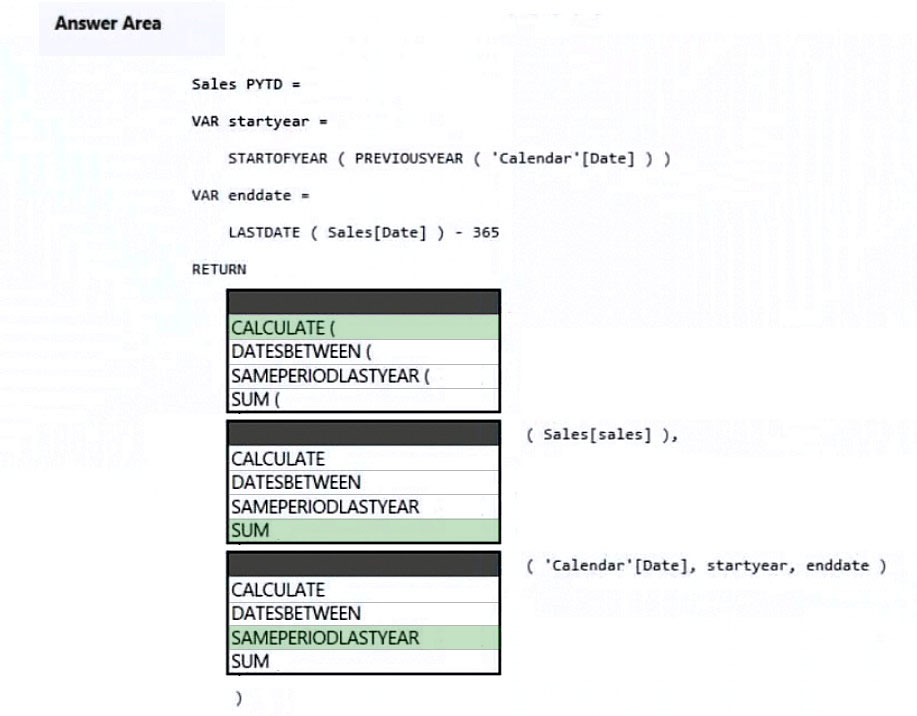
Box 1: CALCULATE -
Example:
Total sales on the last selected date =
CALCULATE (
SUM ( Sales[Sales Amount] ),
'Sales'[OrderDateKey] = MAX ( 'Sales'[OrderDateKey] )
)
Box 2: SUM -
Box 3: SAMEPERIODLASTYEAR -
SAMEPERIODLASTYEAR returns a set of dates in the current selection from the previous year.
Example:
-- SAMEPERIODLASTYEAR returns the selected period shifted back one year.
EVALUATE -
VAR StartDate = DATE ( 2008, 07, 25 )
VAR EndDate = DATE ( 2008, 07, 31 )
RETURN -
CALCULATETABLE (
SAMEPERIODLASTYEAR ( 'Date'[Date] ),
'Date'[Date] >= StartDate &&
'Date'[Date] <= EndDate
)
ORDER BY [Date]
Reference:
https://docs.microsoft.com/en-us/dax/calculate-function-dax
https://dax.guide/sameperiodlastyear/
Question #50
DRAG DROP -
You receive revenue data that must be included in Microsoft Power BI reports.
You preview the data from a Microsoft Excel source in Power Query as shown in the following exhibit.
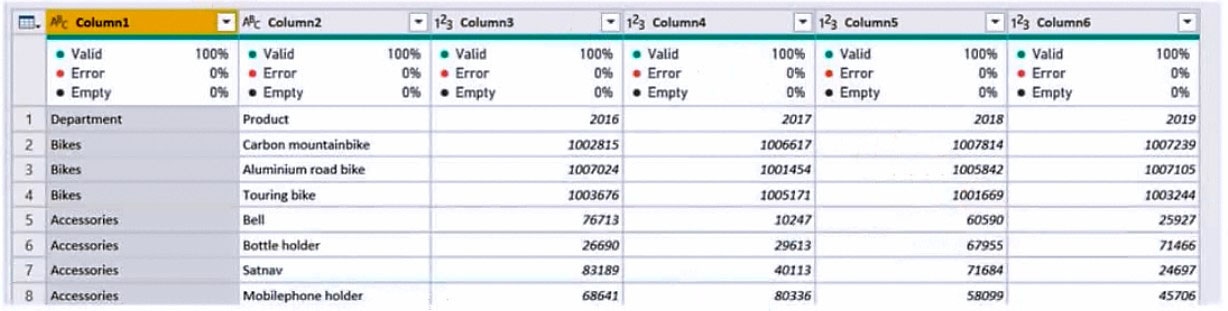
You plan to create several visuals from the data, including a visual that shows revenue split by year and product.
You need to transform the data to ensure that you can build the visuals. The solution must ensure that the columns are named appropriately for the data that they contain.
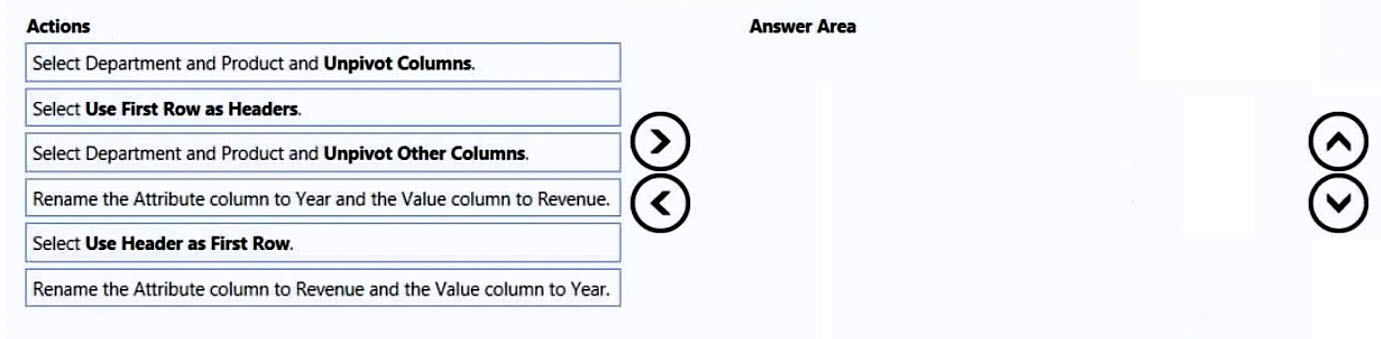
Which three actions should you perform in sequence? To answer, move the appropriate actions from the list of actions to the answer area and arrange them in the correct order.
Select and Place:
You receive revenue data that must be included in Microsoft Power BI reports.
You preview the data from a Microsoft Excel source in Power Query as shown in the following exhibit.
You plan to create several visuals from the data, including a visual that shows revenue split by year and product.
You need to transform the data to ensure that you can build the visuals. The solution must ensure that the columns are named appropriately for the data that they contain.
Which three actions should you perform in sequence? To answer, move the appropriate actions from the list of actions to the answer area and arrange them in the correct order.
Select and Place:
Correct Answer:
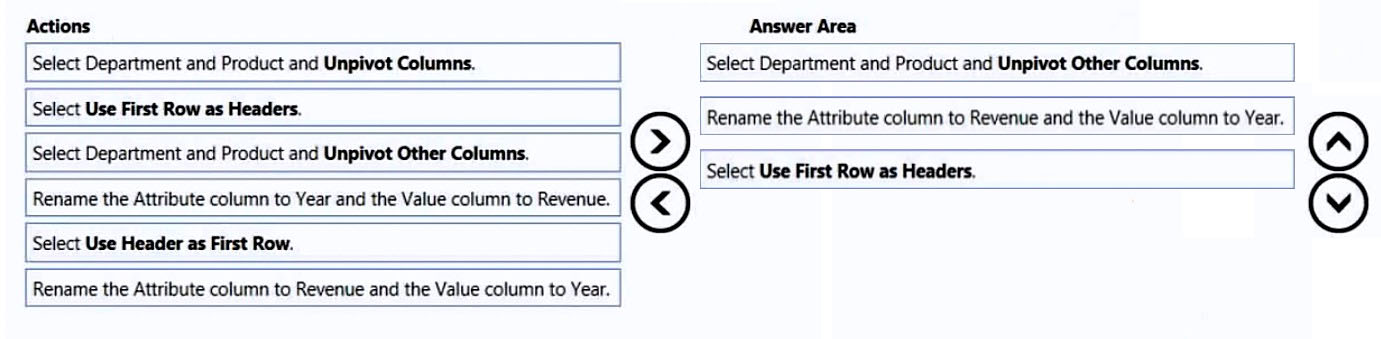
Step 1: Select Department and Product and Unpivot Other Columns
The Unpivot Other Columns command unpivots unselected columns. Use this command in a query when not all columns are known. New columns added during a refresh operation are also unpivoted.
Note: Unpivot columns: In Power Query, you can transform columns into attribute-value pairs, where columns become rows.
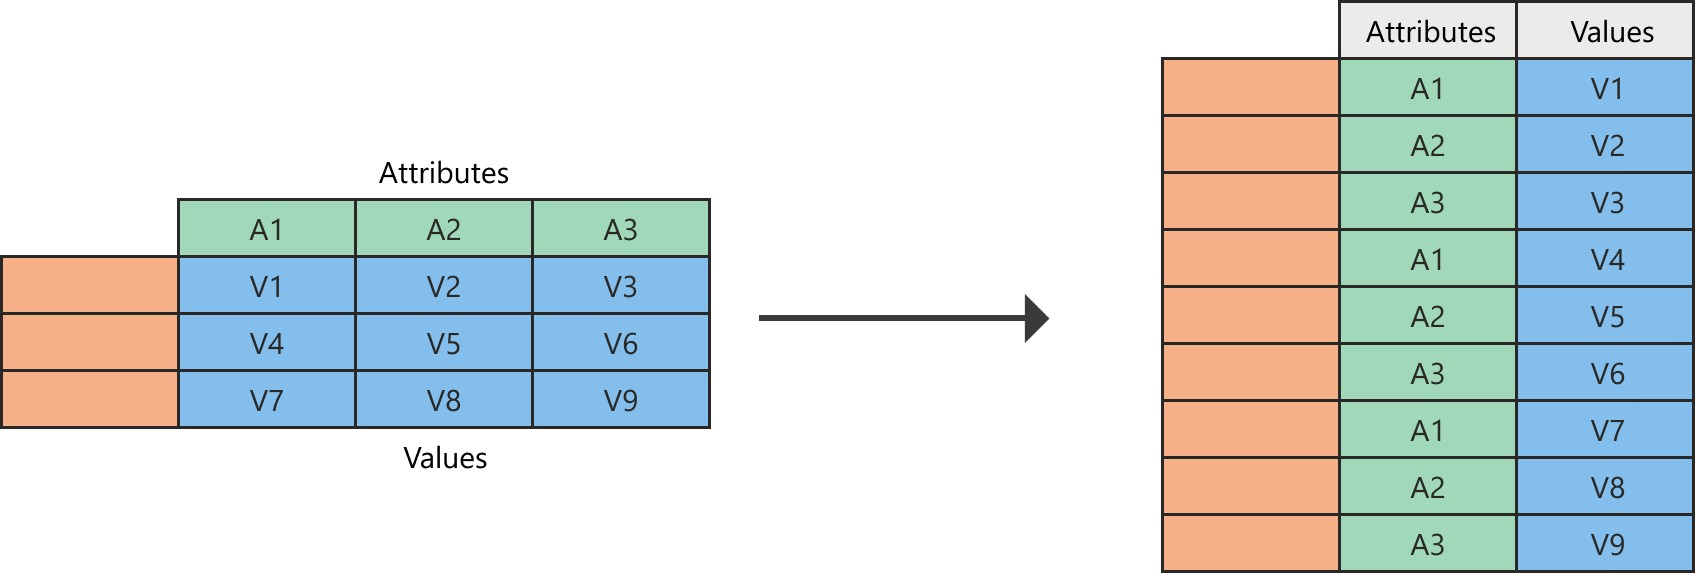
Step 2: Rename the Attribue column to Year and the Value Column to Revenue
Need to do this after the unpivot.
Power Query will always create the attribute-value pair by using two columns:
Attribute: The name of the column headings that were unpivoted.
Value: The values that were underneath each of the unpivoted column headings.
Step 3: Select Use the First Row as Headers
Reference:
https://docs.microsoft.com/en-us/power-query/unpivot-column
Step 1: Select Department and Product and Unpivot Other Columns
The Unpivot Other Columns command unpivots unselected columns. Use this command in a query when not all columns are known. New columns added during a refresh operation are also unpivoted.
Note: Unpivot columns: In Power Query, you can transform columns into attribute-value pairs, where columns become rows.
Step 2: Rename the Attribue column to Year and the Value Column to Revenue
Need to do this after the unpivot.
Power Query will always create the attribute-value pair by using two columns:
Attribute: The name of the column headings that were unpivoted.
Value: The values that were underneath each of the unpivoted column headings.
Step 3: Select Use the First Row as Headers
Reference:
https://docs.microsoft.com/en-us/power-query/unpivot-column
All Pages