Microsoft PL-300 Exam Practice Questions (P. 3)
- Full Access (408 questions)
- One Year of Premium Access
- Access to one million comments
- Seamless ChatGPT Integration
- Ability to download PDF files
- Anki Flashcard files for revision
- No Captcha & No AdSense
- Advanced Exam Configuration
Question #21
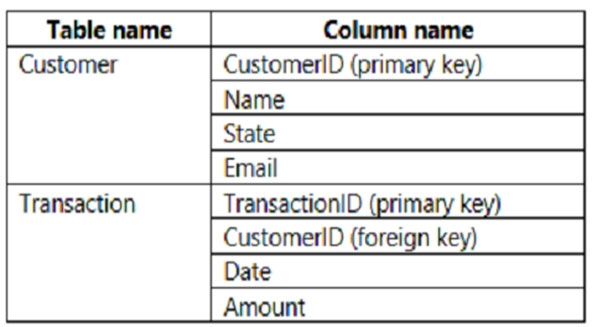
You build a report to analyze customer transactions from a database that contains the tables shown in the following table.
You import the tables.
Which relationship should you use to link the tables?
You import the tables.
Which relationship should you use to link the tables?
Question #23
HOTSPOT -
You create a Power BI dataset that contains the table shown in the following exhibit.
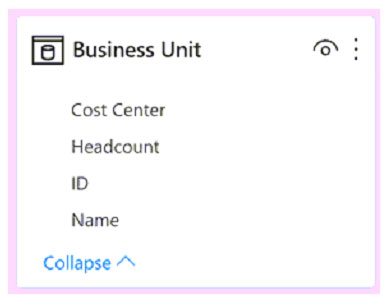
You need to make the table available as an organizational data type in Microsoft Excel.
How should you configure the properties of the table? To answer, select the appropriate options in the answer area.
NOTE: Each correct selection is worth one point.
Hot Area:
You create a Power BI dataset that contains the table shown in the following exhibit.
You need to make the table available as an organizational data type in Microsoft Excel.
How should you configure the properties of the table? To answer, select the appropriate options in the answer area.
NOTE: Each correct selection is worth one point.
Hot Area:
Correct Answer:
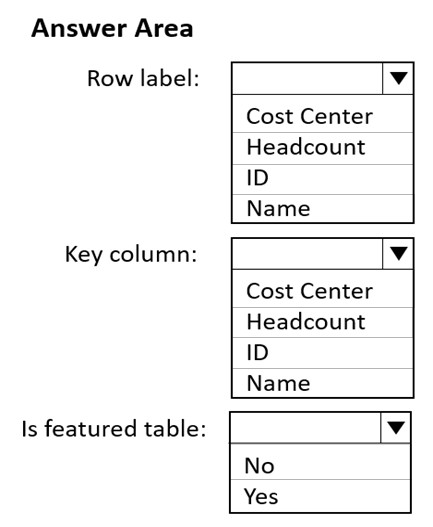
Box 1: Cost Center -
The Row label field value is used in Excel so users can easily identify the row. It appears as the cell value for a linked cell, in the Data Selector pane, and in the
Information card.
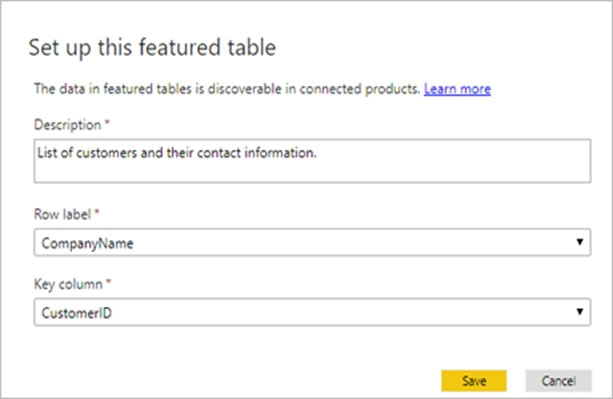
Box 2: ID -
The Key column field value provides the unique ID for the row. This value enables Excel to link a cell to a specific row in the table.
Box 3: Yes -
In the Data Types Gallery in Excel, your users can find data from featured tables in your Power BI datasets.
Reference:
https://docs.microsoft.com/en-us/power-bi/collaborate-share/service-create-excel-featured-tables
Box 1: Cost Center -
The Row label field value is used in Excel so users can easily identify the row. It appears as the cell value for a linked cell, in the Data Selector pane, and in the
Information card.
Box 2: ID -
The Key column field value provides the unique ID for the row. This value enables Excel to link a cell to a specific row in the table.
Box 3: Yes -
In the Data Types Gallery in Excel, your users can find data from featured tables in your Power BI datasets.
Reference:
https://docs.microsoft.com/en-us/power-bi/collaborate-share/service-create-excel-featured-tables
Question #24
You have the Power BI model shown in the following exhibit.
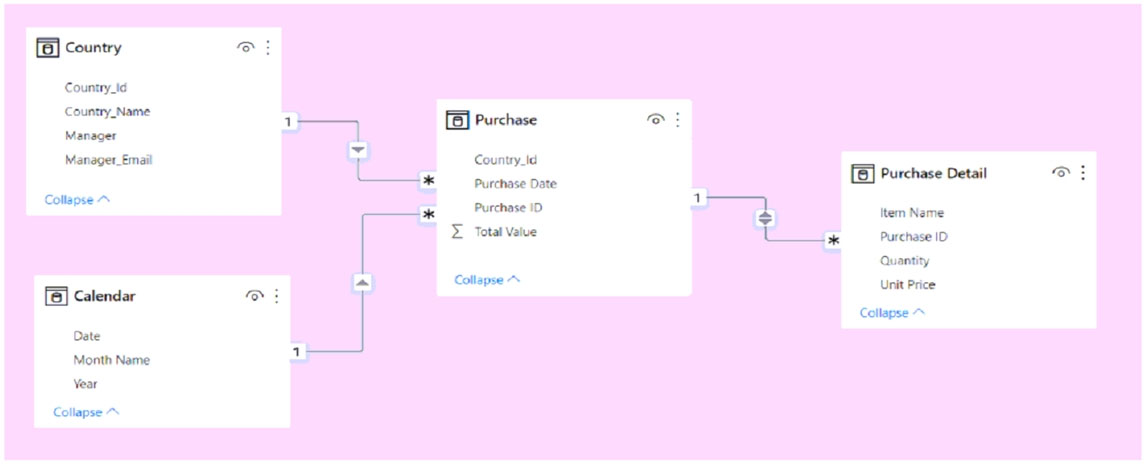
A manager can represent only a single country.
You need to use row-level security (RLS) to meet the following requirements:
✑ The managers must only see the data of their respective country.
✑ The number of RLS roles must be minimized.
Which two actions should you perform? Each correct answer presents a complete solution.
NOTE: Each correct selection is worth one point.
Question #25
HOTSPOT -
You have a Power BI imported dataset that contains the data model shown in the following exhibit.
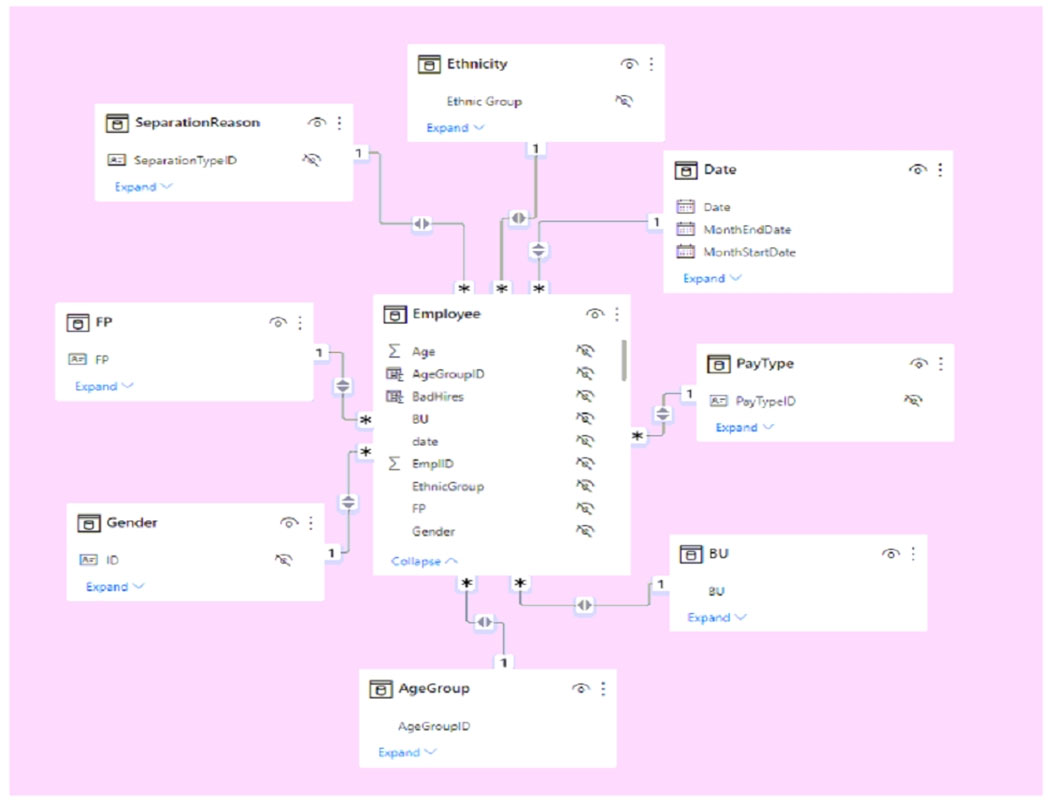
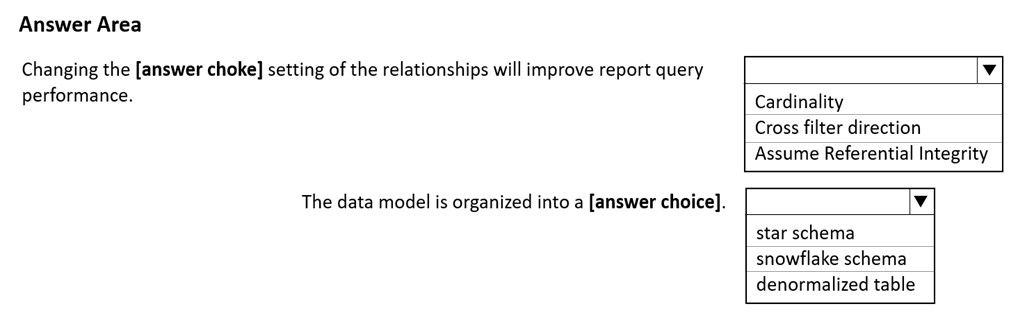
Use the drop-down menus to select the answer choice that completes each statement based on the information presented in the graphic.
NOTE: Each correct selection is worth one point.
Hot Area:
You have a Power BI imported dataset that contains the data model shown in the following exhibit.
Use the drop-down menus to select the answer choice that completes each statement based on the information presented in the graphic.
NOTE: Each correct selection is worth one point.
Hot Area:
Correct Answer:
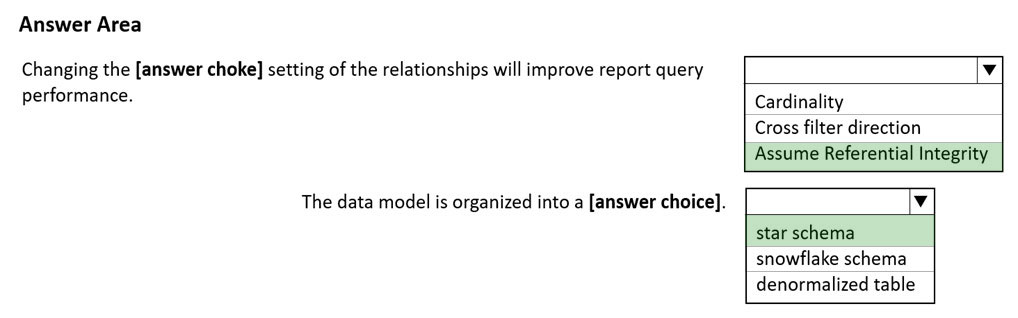
Box 1: Assume Referential Integrity
When connecting to a data source using DirectQuery, you can use the Assume Referential Integrity selection to enable running more efficient queries against your data source. This feature has a few requirements of the underlying data, and it is only available when using DirectQuery.
Note: The following requirements are necessary for Assume referential integrity to work properly:
Data in the From column in the relationship is never Null or blank
For each value in the From column, there is a corresponding value in the To column
Box 2: Star schema -
Star schema is a mature modeling approach widely adopted by relational data warehouses. It requires modelers to classify their model tables as either dimension or fact.
Generally, dimension tables contain a relatively small number of rows. Fact tables, on the other hand, can contain a very large number of rows and continue to grow over time.
Example:
Reference:
https://docs.microsoft.com/en-us/power-bi/connect-data/desktop-assume-referential-integrity https://docs.microsoft.com/en-us/power-bi/guidance/star-schema
Question #26
HOTSPOT -
You have a Power BI model that contains a table named Sales and a related date table. Sales contains a measure named Total Sales.
You need to create a measure that calculates the total sales from the equivalent month of the previous year.
How should you complete the calculation? To answer, select the appropriate options in the answer area.
NOTE: Each correct selection is worth one point.
Hot Area:
Correct Answer:
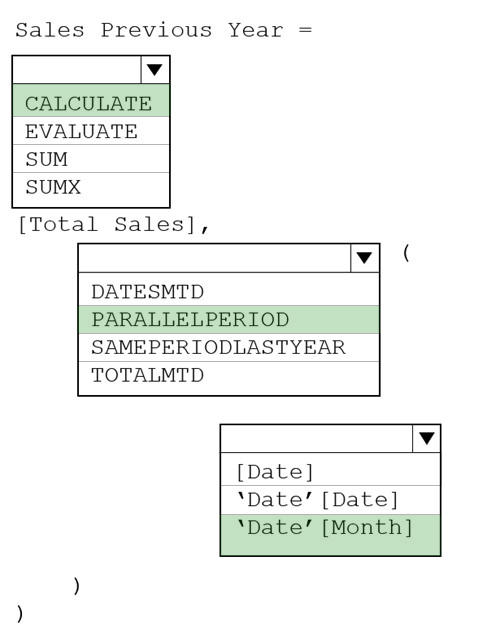
Box 1: CALCULATE -
Box 2: PARALLELPERIOD -
PARALLELPERIOD returns a table that contains a column of dates that represents a period parallel to the dates in the specified dates column, in the current context, with the dates shifted a number of intervals either forward in time or back in time.
Syntax: PARALLELPERIOD(<dates>,<number_of_intervals>,<interval>) dates: A column that contains dates. interval: The interval by which to shift the dates. The value for interval can be one of the following: year, quarter, month.
Incorrect:
SAMEPERIODLASTYEAR returns a table that contains a column of dates shifted one year back in time from the dates in the specified dates column, in the current context.
Syntax: SAMEPERIODLASTYEAR(<dates>)
DATESMTD returns a table that contains a column of the dates for the month to date, in the current context.
Syntax: DATESMTD(<dates>)
Box 3: 'DATE' [Month]
Reference:
https://docs.microsoft.com/en-us/dax/parallelperiod-function-dax https://docs.microsoft.com/en-us/dax/sameperiodlastyear-function-dax
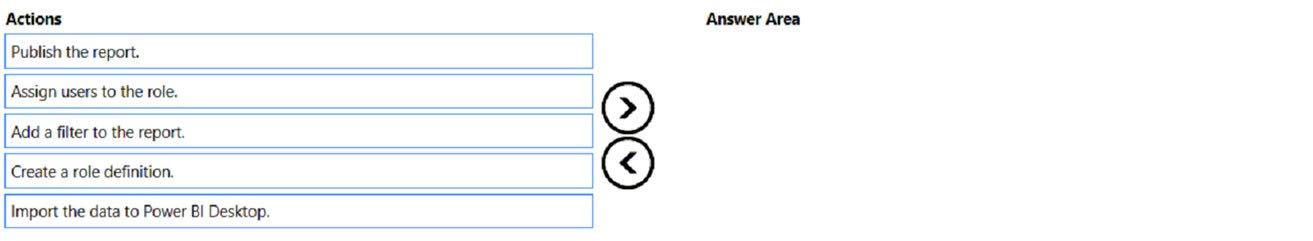
Question #27
DRAG DROP -
You plan to create a report that will display sales data from the last year for multiple regions.
You need to restrict access to individual rows of the data on a per region-basis by using roles.
Which four actions should you perform in sequence? To answer, move the appropriate actions from the list of actions to the answer area and arrange them in the correct order.
Select and Place:
Correct Answer:
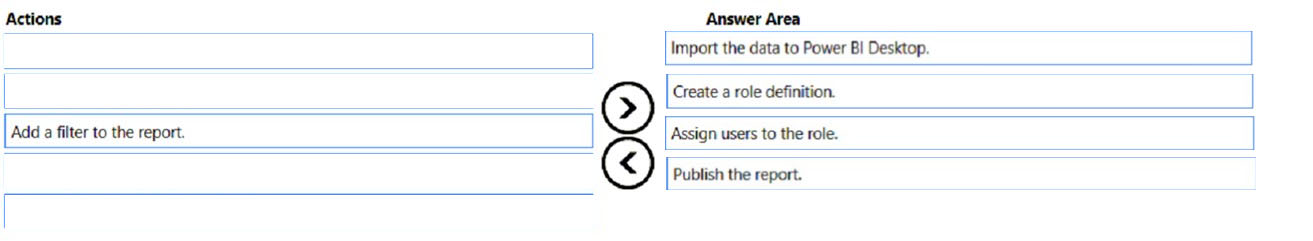
You can define roles and rules within Power BI Desktop. When you publish to Power BI, it also publishes the role definitions.
To define security roles, follow these steps.
1. Import data into your Power BI Desktop report (Step 1)
2. From the Modeling tab, select Manage Roles.
3. From the Manage roles window, select Create. (Step 2)
4. Under Roles, provide a name for the role.
5. Under Tables, select the table to which you want to apply a DAX rule.
6. In the Table filter DAX expression box, enter the DAX expressions. This expression returns a value of true or false. For example: [Entity ID] = ג€Valueג€(Step 3)
7. After you've created the DAX expression, select the checkmark above the expression box to validate the expression.
8. Select Save.
Step 3: Assign Users to the role.
You can't assign users to a role within Power BI Desktop. You assign them in the Power BI service.
After you've created your roles, test the results of the roles within Power BI Desktop.
Step 4: Publish the report.
Now that you're done validating the roles in Power BI Desktop, go ahead and publish your report to the Power BI service.
Reference:
https://docs.microsoft.com/en-us/power-bi/enterprise/service-admin-rls
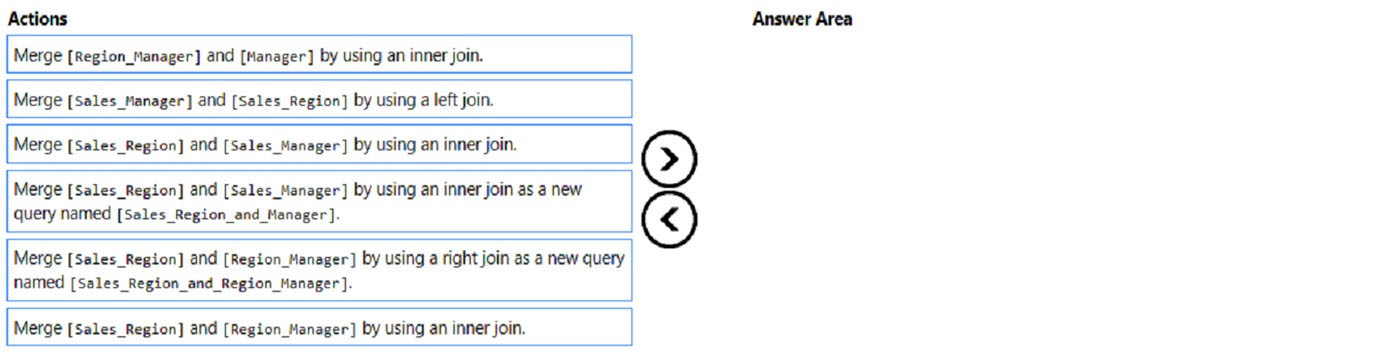
Question #28
DRAG DROP -
You create a data model in Power BI.
Report developers and users provide feedback that the data model is too complex.
The model contains the following tables.
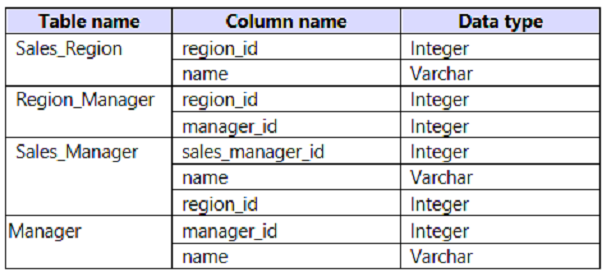
The model has the following relationships:
✑ There is a one-to-one relationship between Sales_Region and Region_Manager.
✑ There are more records in Manager than in Region_Manager, but every record in Region_Manager has a corresponding record in Manager.
✑ There are more records in Sales_Manager than in Sales_Region, but every record in Sales_Region has a corresponding record in Sales_Manager.
You need to denormalize the model into a single table. Only managers who are associated to a sales region must be included in the reports.
Which three actions should you perform in sequence? To answer, move the appropriate actions from the list of actions to the answer area and arrange them in the correct order.
NOTE: More than one order of answer choices is correct. You will receive credit for any of the correct orders you select.
Select and Place:
You create a data model in Power BI.
Report developers and users provide feedback that the data model is too complex.
The model contains the following tables.
The model has the following relationships:
✑ There is a one-to-one relationship between Sales_Region and Region_Manager.
✑ There are more records in Manager than in Region_Manager, but every record in Region_Manager has a corresponding record in Manager.
✑ There are more records in Sales_Manager than in Sales_Region, but every record in Sales_Region has a corresponding record in Sales_Manager.
You need to denormalize the model into a single table. Only managers who are associated to a sales region must be included in the reports.
Which three actions should you perform in sequence? To answer, move the appropriate actions from the list of actions to the answer area and arrange them in the correct order.
NOTE: More than one order of answer choices is correct. You will receive credit for any of the correct orders you select.
Select and Place:
Correct Answer:
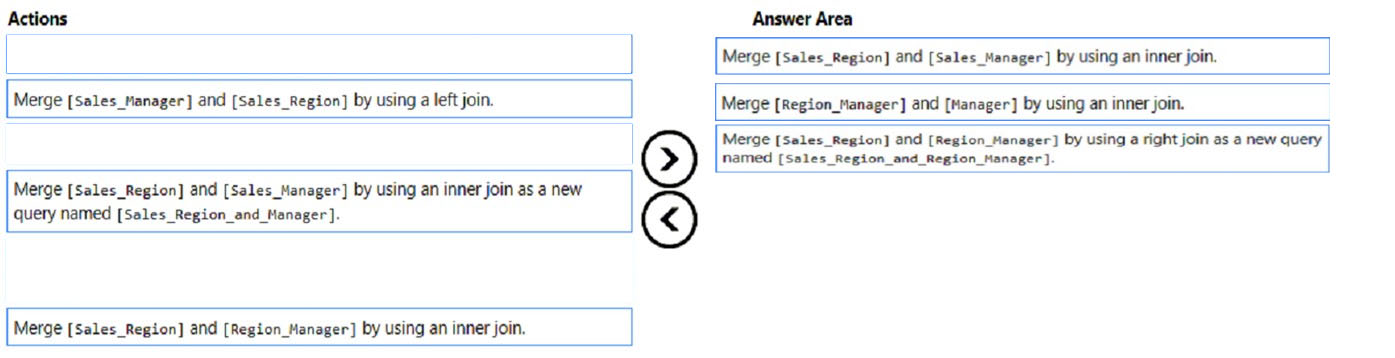
Step 1: Merge [Sales_Region] and [Sales_Manager] by using an inner join.
Inner Join: Returns the rows present in both Left and right table only if there is a match. Otherwise, it returns zero records.
Note: Sales_Region and Sales_manager
There is a one-to-one relationship between Sales_Region and Region_Manager.
There are more records in Sales_Manager than in Sales_Region, but every record in Sales_Region has a corresponding record in Sales_Manager.
Step 2: Merge [Region_Manager] and [Manager] by using inner join.
Only managers who are associated to a sales region must be included in the reports.
Note: Region_Manager and Manager.
There are more records in Manager than in Region_Manager, but every record in Region_Manager has a corresponding record in Manager.
Step 3: Merge [Sales_region] and [Region_Manager] by using a right join as new query named [Sales_region_and_Region_Manager]
Reference:
https://www.tutorialgateway.org/joins-in-power-bi/
Question #30
HOTSPOT -
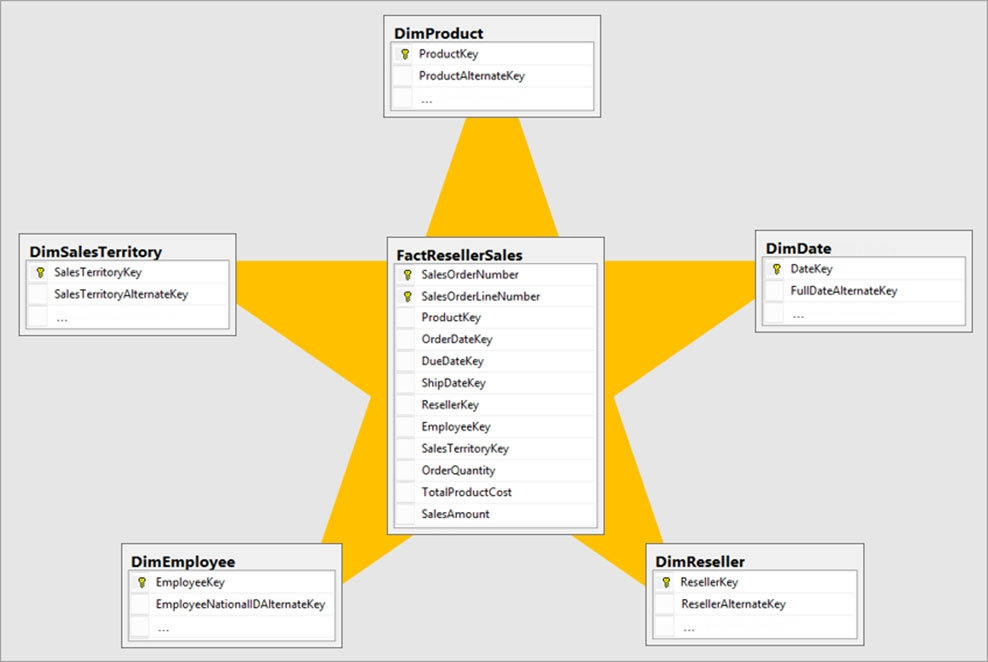
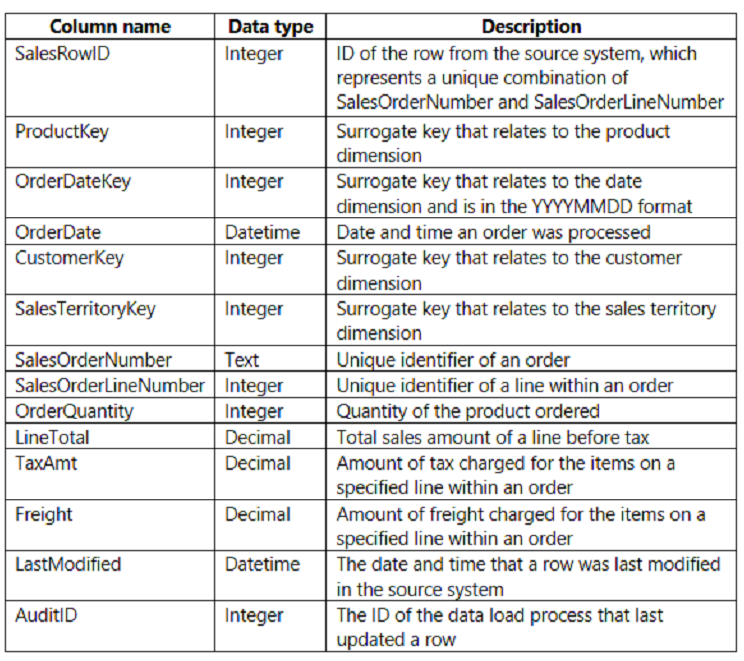
You are creating a Microsoft Power BI imported data model to perform basket analysis. The goal of the analysis is to identify which products are usually bought together in the same transaction across and within sales territories.
You import a fact table named Sales as shown in the exhibit. (Click the Exhibit tab.)
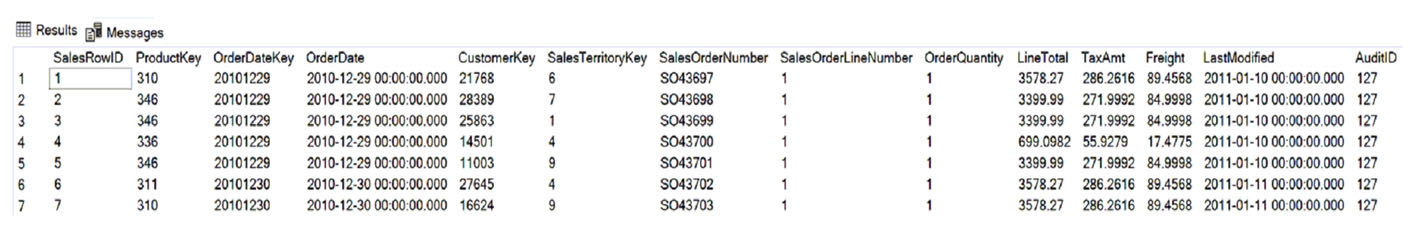
The related dimension tables are imported into the model.
Sales contains the data shown in the following table.
You are evaluating how to optimize the model.
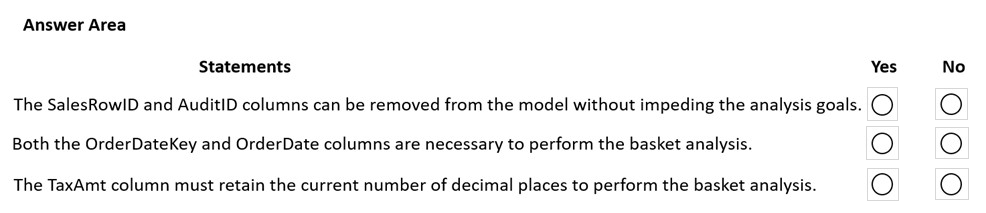
For each of the following statements, select Yes if the statement is true. Otherwise, select No.
NOTE: Each correct selection is worth one point.
Hot Area:
You are creating a Microsoft Power BI imported data model to perform basket analysis. The goal of the analysis is to identify which products are usually bought together in the same transaction across and within sales territories.
You import a fact table named Sales as shown in the exhibit. (Click the Exhibit tab.)
The related dimension tables are imported into the model.
Sales contains the data shown in the following table.
You are evaluating how to optimize the model.
For each of the following statements, select Yes if the statement is true. Otherwise, select No.
NOTE: Each correct selection is worth one point.
Hot Area:
Correct Answer:
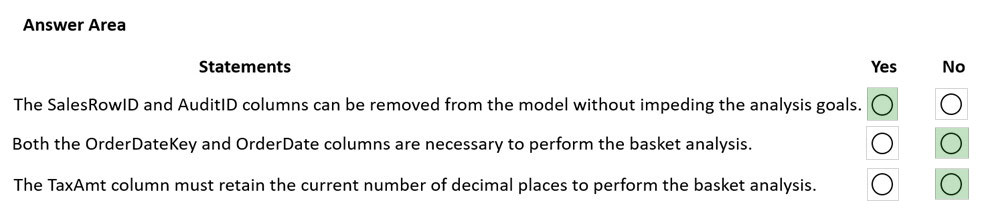
Box 1: Yes -
Those two columns not need in the analysis.
Box 2: No -
Can remove the surrogate key OrderDateKey from the analysis.
Box 3: No -
Tax charged not relevant for the analysis.
Box 1: Yes -
Those two columns not need in the analysis.
Box 2: No -
Can remove the surrogate key OrderDateKey from the analysis.
Box 3: No -
Tax charged not relevant for the analysis.
All Pages