Microsoft PL-300 Exam Practice Questions (P. 2)
- Full Access (408 questions)
- One Year of Premium Access
- Access to one million comments
- Seamless ChatGPT Integration
- Ability to download PDF files
- Anki Flashcard files for revision
- No Captcha & No AdSense
- Advanced Exam Configuration
Question #12
HOTSPOT -
You are profiling data by using Power Query Editor.
You have a table named Reports that contains a column named State. The distribution and quality data metrics for the data in State is shown in the following exhibit.

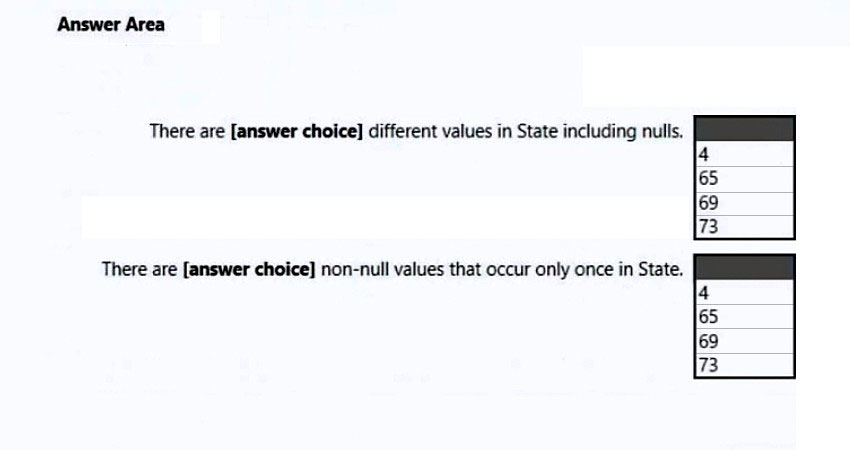
Use the drop-down menus to select the answer choice that completes each statement based on the information presented in the graphic.
NOTE: Each correct selection is worth one point.
Hot Area:
You are profiling data by using Power Query Editor.
You have a table named Reports that contains a column named State. The distribution and quality data metrics for the data in State is shown in the following exhibit.
Use the drop-down menus to select the answer choice that completes each statement based on the information presented in the graphic.
NOTE: Each correct selection is worth one point.
Hot Area:
Correct Answer:
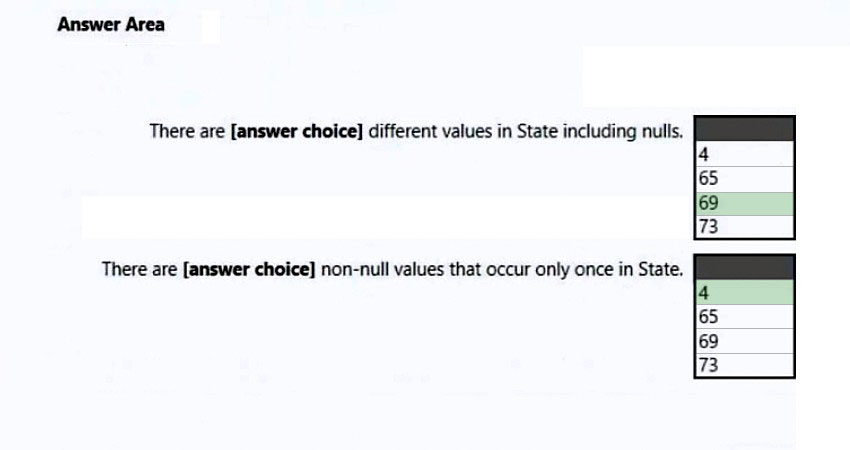
Box 1: 69 -
69 distinct/different values.
Note: Column Distribution allows you to get a sense for the overall distribution of values within a column in your data previews, including the count of distinct values (total number of different values found in a given column) and unique values (total number of values that only appear once in a given column).
Box 2: 4 -
Reference:
https://systemmanagement.ro/2018/10/16/power-bi-data-profiling-distinct-vs-unique/
Question #13
HOTSPOT -
You have two CSV files named Products and Categories.
The Products file contains the following columns:
✑ ProductID
✑ ProductName
✑ SupplierID
✑ CategoryID
The Categories file contains the following columns:
✑ CategoryID
✑ CategoryName
✑ CategoryDescription
From Power BI Desktop, you import the files into Power Query Editor.
You need to create a Power BI dataset that will contain a single table named Product. The Product will table includes the following columns:
✑ ProductID
✑ ProductName
✑ SupplierID
✑ CategoryID
✑ CategoryName
✑ CategoryDescription
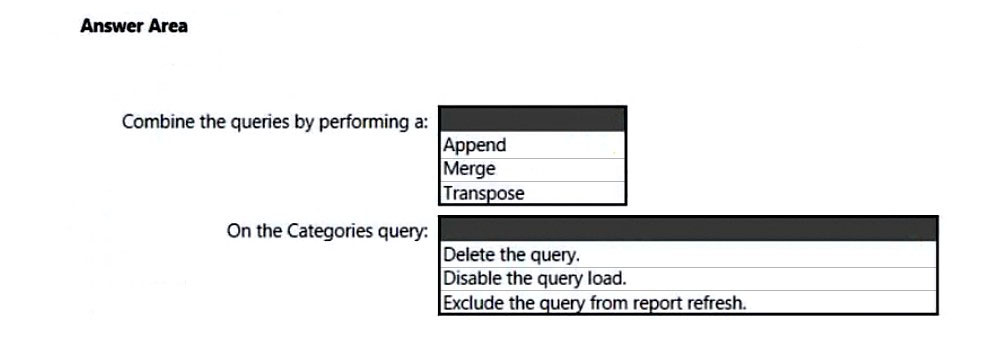
How should you combine the queries, and what should you do on the Categories query? To answer, select the appropriate options in the answer area.
NOTE: Each correct selection is worth one point.
Hot Area:
You have two CSV files named Products and Categories.
The Products file contains the following columns:
✑ ProductID
✑ ProductName
✑ SupplierID
✑ CategoryID
The Categories file contains the following columns:
✑ CategoryID
✑ CategoryName
✑ CategoryDescription
From Power BI Desktop, you import the files into Power Query Editor.
You need to create a Power BI dataset that will contain a single table named Product. The Product will table includes the following columns:
✑ ProductID
✑ ProductName
✑ SupplierID
✑ CategoryID
✑ CategoryName
✑ CategoryDescription
How should you combine the queries, and what should you do on the Categories query? To answer, select the appropriate options in the answer area.
NOTE: Each correct selection is worth one point.
Hot Area:
Correct Answer:
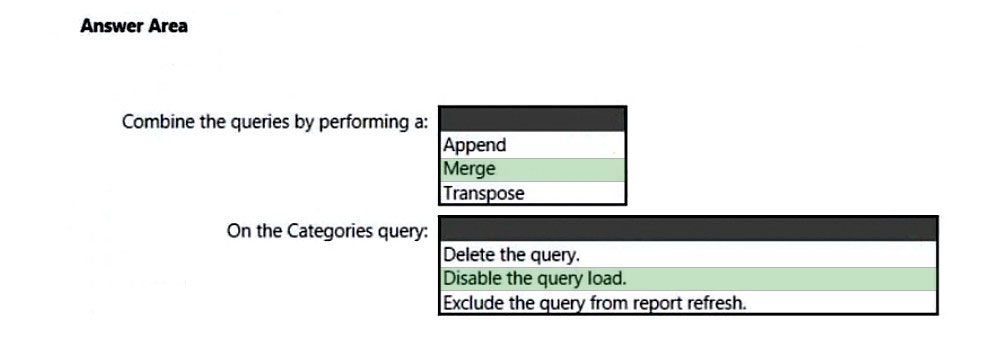
Box 1: Merge -
There are two primary ways of combining queries: merging and appending.
* When you have one or more columns that you'd like to add to another query, you merge the queries.
* When you have additional rows of data that you'd like to add to an existing query, you append the query.
Box 2: Disable the query load -
Managing loading of queries -
In many situations, it makes sense to break down your data transformations in multiple queries. One popular example is merging where you merge two queries into one to essentially do a join. In this type of situations, some queries are not relevant to load into Desktop as they are intermediate steps, while they are still required for your data transformations to work correctly. For these queries, you can make sure they are not loaded in Desktop by un-checking 'Enable load' in the context menu of the query in Desktop or in the Properties screen:
Reference:
https://docs.microsoft.com/en-us/power-bi/connect-data/desktop-shape-and-combine-data https://docs.microsoft.com/en-us/power-bi/connect-data/refresh-include-in-report-refresh
Question #15
DRAG DROP -
You have a folder that contains 100 CSV files.
You need to make the file metadata available as a single dataset by using Power BI. The solution must NOT store the data of the CSV files.
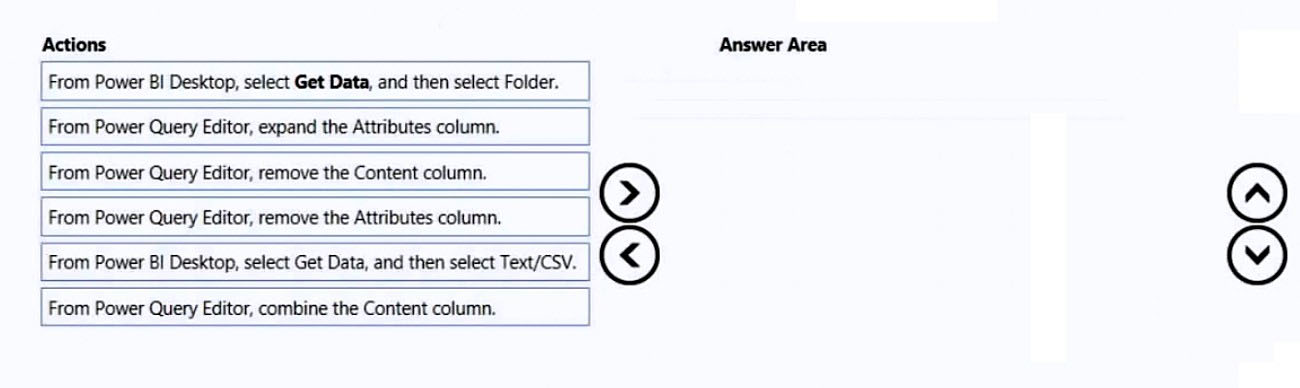
Which three actions should you perform in sequence. To answer, move the appropriate actions from the list of actions to the answer area and arrange them in the correct order.
Select and Place:
You have a folder that contains 100 CSV files.
You need to make the file metadata available as a single dataset by using Power BI. The solution must NOT store the data of the CSV files.
Which three actions should you perform in sequence. To answer, move the appropriate actions from the list of actions to the answer area and arrange them in the correct order.
Select and Place:
Correct Answer:
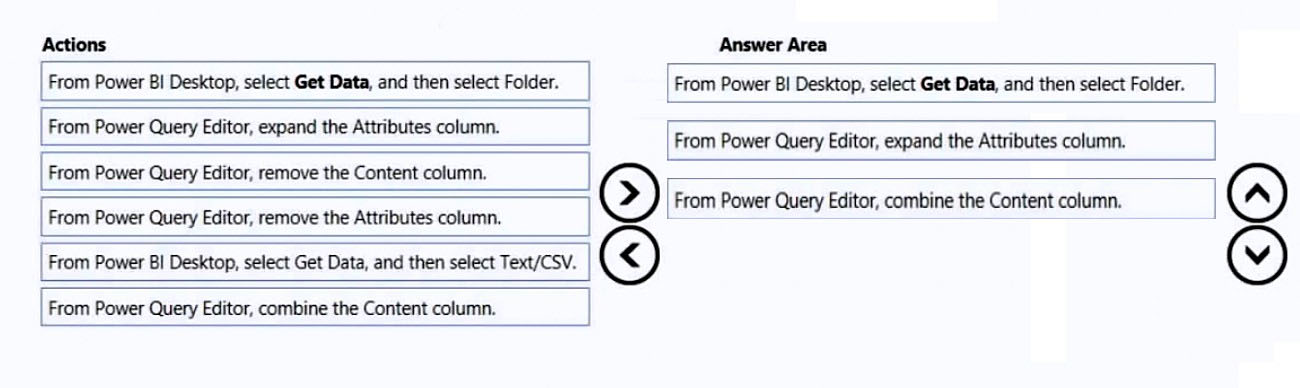
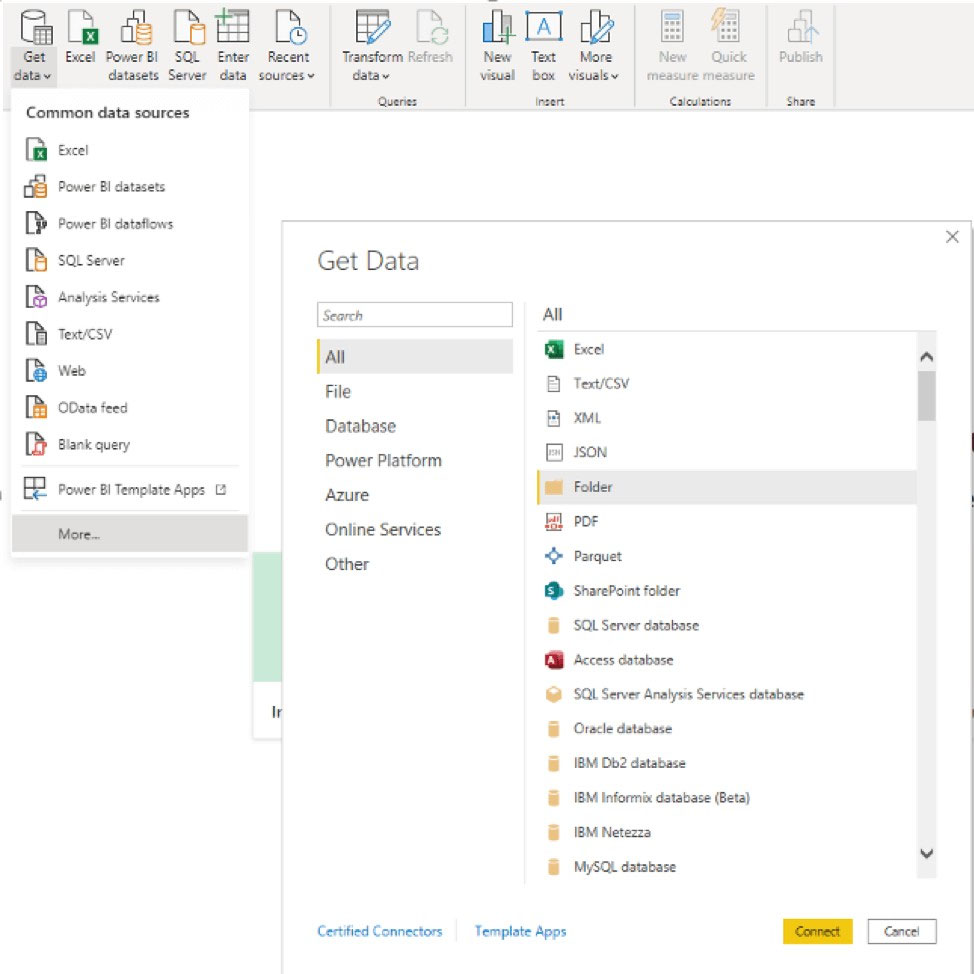
Step 1: From Power BI Desktop, Select Get Data, and then Select Folder.
Open Power BI Desktop and then select Get Data\Moreג€¦ and choose Folder from the All options on the left.
Enter the folder path, select OK, and then select Transform data to see the folder's files in Power Query Editor.
Step 2: From Power Query Editor, expand the Attributes column.
Step 3: From Power Query Editor, combine the Content column.
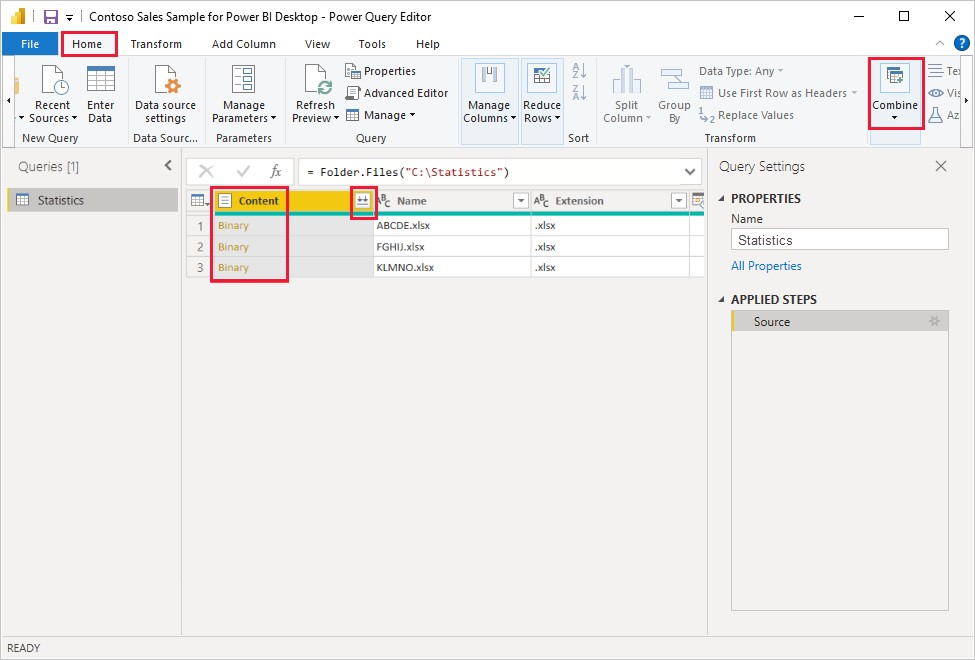
Combine files behavior -
To combine binary files in Power Query Editor, select Content (the first column label) and select Home > Combine Files. Or you can just select the Combine Files icon next to Content.
Reference:
https://docs.microsoft.com/en-us/power-bi/transform-model/desktop-combine-binaries
Step 1: From Power BI Desktop, Select Get Data, and then Select Folder.
Open Power BI Desktop and then select Get Data\Moreג€¦ and choose Folder from the All options on the left.
Enter the folder path, select OK, and then select Transform data to see the folder's files in Power Query Editor.
Step 2: From Power Query Editor, expand the Attributes column.
Step 3: From Power Query Editor, combine the Content column.
Combine files behavior -
To combine binary files in Power Query Editor, select Content (the first column label) and select Home > Combine Files. Or you can just select the Combine Files icon next to Content.
Reference:
https://docs.microsoft.com/en-us/power-bi/transform-model/desktop-combine-binaries
Question #19
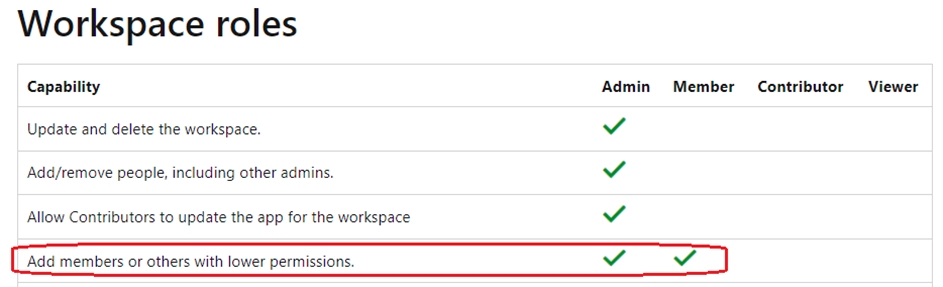
You need to provide a user with the ability to add members to a workspace. The solution must use the principle of least privilege.
Which role should you assign to the user?
Which role should you assign to the user?
- AViewer
- BAdmin
- CContributor
- DMember
Correct Answer:
D
Member role allows adding members or other with lower permissions to the workspace.
Reference:
https://docs.microsoft.com/en-us/power-bi/collaborate-share/service-roles-new-workspaces
D
Member role allows adding members or other with lower permissions to the workspace.
Reference:
https://docs.microsoft.com/en-us/power-bi/collaborate-share/service-roles-new-workspaces
Question #20
You have a Power BI query named Sales that imports the columns shown in the following table.
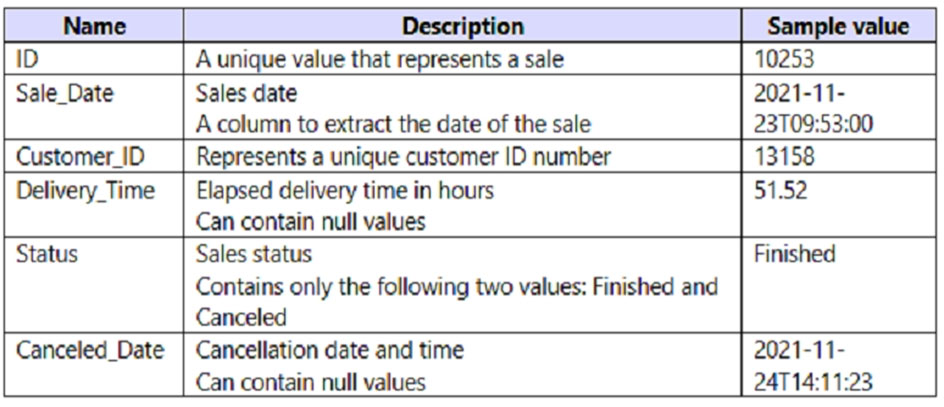
Users only use the date part of the Sales_Date field. Only rows with a Status of Finished are used in analysis.
You need to reduce the load times of the query without affecting the analysis.
Which two actions achieve this goal? Each correct answer presents a complete solution.
NOTE: Each correct selection is worth one point.
All Pages