Microsoft AZ-400 Exam Practice Questions (P. 5)
- Full Access (565 questions)
- One Year of Premium Access
- Access to one million comments
- Seamless ChatGPT Integration
- Ability to download PDF files
- Anki Flashcard files for revision
- No Captcha & No AdSense
- Advanced Exam Configuration
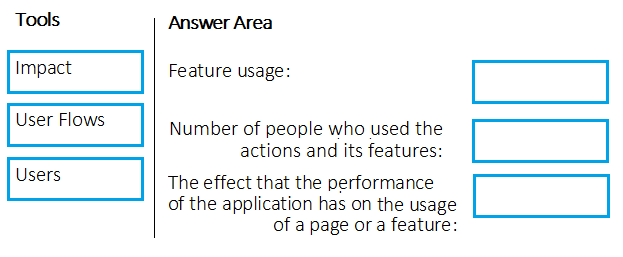
Question #43
DRAG DROP -
Your company wants to use Azure Application Insights to understand how user behaviors affect an application.
Which Application Insights tool should you use to analyze each behavior? To answer, drag the appropriate tools to the correct behaviors. Each tool may be used once, more than once, or not at all. You may need to drag the split bar between panes or scroll to view content.
NOTE: Each correct selection is worth one point.
Select and Place:
Correct Answer:
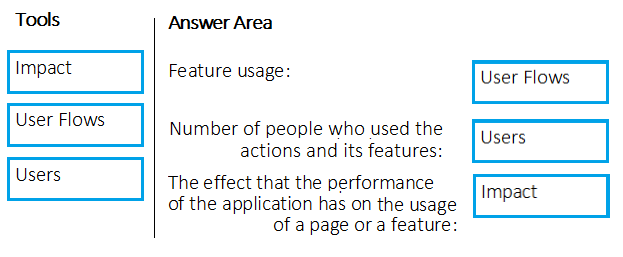
Box 1: User Flows -
The User Flows tool visualizes how users navigate between the pages and features of your site. It's great for answering questions like:
How do users navigate away from a page on your site?
What do users click on a page on your site?
Where are the places that users churn most from your site?
Are there places where users repeat the same action over and over?
Box 2: Users -
Counting Users: The user behavior analytics tools don't currently support counting users or sessions based on properties other than anonymous user ID, authenticated user ID, or session ID.
Box 3: Impact -
Impact analyzes how load times and other properties influence conversion rates for various parts of your app. To put it more precisely, it discovers how any dimension of a page view, custom event, or request affects the usage of a different page view or custom event.
Reference:
https://docs.microsoft.com/en-us/azure/azure-monitor/app/usage-flows https://docs.microsoft.com/en-us/azure/azure-monitor/app/usage-impact https://docs.microsoft.com/en-us/azure/azure-monitor/app/usage-troubleshoot
Question #45
You have an Azure DevOps project named Project1 and an Azure subscription named Sub1. Sub1 contains an Azure virtual machine scale set named VMSS1.
VMSS1 hosts a web application named WebApp1. WebApp1 uses stateful sessions.
The WebApp1 installation is managed by using the Custom Script extension. The script resides in an Azure Storage account named sa1.
You plan to make a minor change to a UI element of WebApp1 and to gather user feedback about the change.
You need to implement limited user testing for the new version of WebApp1 on VMSS1.
Which three actions should you perform? Each correct answer presents part of the solution.
NOTE: Each correct selection is worth one point.
- AModify the load balancer settings of VMSS1.
- BRedeploy VMSS1.
- CUpload a custom script file to sa1.
- DModify the Custom Script extension settings of VMSS1.
- EUpdate the configuration of a virtual machine in VMSS1.
Correct Answer:
BCD
BCD
 GPT
GPT
For the scenario described in updating WebApp1 with minor UI changes and testing them on a subset of users, uploading the custom script (C) to the Azure Storage account (sa1) is essential. Moreover, modifying the Custom Script extension settings (D) on VMSS1 is pivotal as it ensures that the new script gets deployed appropriately to the relevant VMs. Redeployment of VMSS1 (B) plays a critical role because it applies the updated configuration and custom script across the VM instances tailored with the new changes, enabling precise and efficient testing of the updated application. Altering the load balancer or updating individual VM configurations isn't necessary in this case, as the key is updating the deployment and scripting configurations to reflect the minor UI adjustments effectively.
Question #46
SIMULATION -
You need to create a notification if the peak average response time of an Azure web app named az400-123456789-main is more than five seconds when evaluated during a five-minute period. The notification must trigger the `https://contoso.com/notify` webhook.
To complete this task, sign in to the Microsoft Azure portal.
Correct Answer:
See explanation below.
1. Open Microsoft Azure Portal
2. Log into your Azure account and go to App Service and look under Monitoring then you will see Alert.
3. Select Add an alert rule
4. Configure the alert rule as per below and click Ok.
Source: Alert on Metrics -
Resource Group: az400-123456789-main
Resource: az400-123456789-main -
Threshold: 5 -
Period: Over the last 5 minutes -
Webhook: https://contoso.com/notify
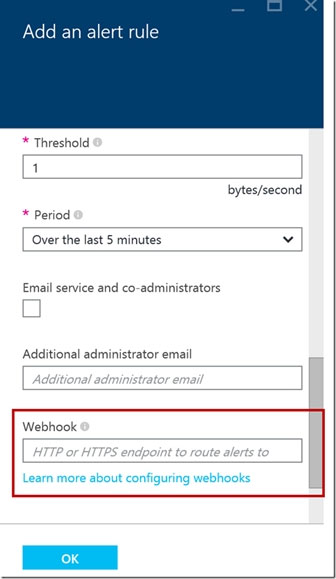
Reference:
https://azure.microsoft.com/es-es/blog/webhooks-for-azure-alerts/
See explanation below.
1. Open Microsoft Azure Portal
2. Log into your Azure account and go to App Service and look under Monitoring then you will see Alert.
3. Select Add an alert rule
4. Configure the alert rule as per below and click Ok.
Source: Alert on Metrics -
Resource Group: az400-123456789-main
Resource: az400-123456789-main -
Threshold: 5 -
Period: Over the last 5 minutes -
Webhook: https://contoso.com/notify
Reference:
https://azure.microsoft.com/es-es/blog/webhooks-for-azure-alerts/
Question #47
SIMULATION -
You need to create and configure an Azure Storage account named az400lod123456789stor in a resource group named RG1lod123456789 to store the boot diagnostics for a virtual machine named VM1.
To complete this task, sign in to the Microsoft Azure portal.
You need to create and configure an Azure Storage account named az400lod123456789stor in a resource group named RG1lod123456789 to store the boot diagnostics for a virtual machine named VM1.
To complete this task, sign in to the Microsoft Azure portal.
Correct Answer:
See explanation below.
Step 1: To create a general-purpose v2 storage account in the Azure portal, follow these steps:
1. On the Azure portal menu, select All services. In the list of resources, type Storage Accounts. As you begin typing, the list filters based on your input. Select
Storage Accounts.
2. On the Storage Accounts window that appears, choose Add.
3. Select the subscription in which to create the storage account.
4. Under the Resource group field, select RG1lod123456789
5. Next, enter a name for your storage account named: az400lod123456789stor
6. Select Create.
Step 2: Enable boot diagnostics on existing virtual machine
To enable Boot diagnostics on an existing virtual machine, follow these steps:
1. Sign in to the Azure portal, and then select the virtual machine VM1.
2. In the Support + troubleshooting section, select Boot diagnostics, then select the Settings tab.
3. In Boot diagnostics settings, change the status to On, and from the Storage account drop-down list, select the storage account az400lod123456789stor.
4. Save the change.
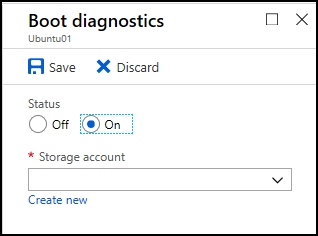
You must restart the virtual machine for the change to take effect.
Reference:
https://docs.microsoft.com/en-us/azure/storage/common/storage-account-create https://docs.microsoft.com/en-us/azure/virtual-machines/troubleshooting/boot-diagnostics
See explanation below.
Step 1: To create a general-purpose v2 storage account in the Azure portal, follow these steps:
1. On the Azure portal menu, select All services. In the list of resources, type Storage Accounts. As you begin typing, the list filters based on your input. Select
Storage Accounts.
2. On the Storage Accounts window that appears, choose Add.
3. Select the subscription in which to create the storage account.
4. Under the Resource group field, select RG1lod123456789
5. Next, enter a name for your storage account named: az400lod123456789stor
6. Select Create.
Step 2: Enable boot diagnostics on existing virtual machine
To enable Boot diagnostics on an existing virtual machine, follow these steps:
1. Sign in to the Azure portal, and then select the virtual machine VM1.
2. In the Support + troubleshooting section, select Boot diagnostics, then select the Settings tab.
3. In Boot diagnostics settings, change the status to On, and from the Storage account drop-down list, select the storage account az400lod123456789stor.
4. Save the change.
You must restart the virtual machine for the change to take effect.
Reference:
https://docs.microsoft.com/en-us/azure/storage/common/storage-account-create https://docs.microsoft.com/en-us/azure/virtual-machines/troubleshooting/boot-diagnostics
Question #48
SIMULATION -
You have a web app that connects to an Azure SQL Database named db1.
You need to configure db1 to send Query Store runtime statistics to Azure Log Analytics.
To complete this task, sign in to the Microsoft Azure portal.
You have a web app that connects to an Azure SQL Database named db1.
You need to configure db1 to send Query Store runtime statistics to Azure Log Analytics.
To complete this task, sign in to the Microsoft Azure portal.
Correct Answer:
See explanation below.
To enable streaming of diagnostic telemetry for a single or a pooled database, follow these steps:
1. Go to Azure SQL database resource.
2. Select Diagnostics settings.
3. Select Turn on diagnostics if no previous settings exist, or select Edit setting to edit a previous setting. You can create up to three parallel connections to stream diagnostic telemetry.
4. Select Add diagnostic setting to configure parallel streaming of diagnostics data to multiple resources.
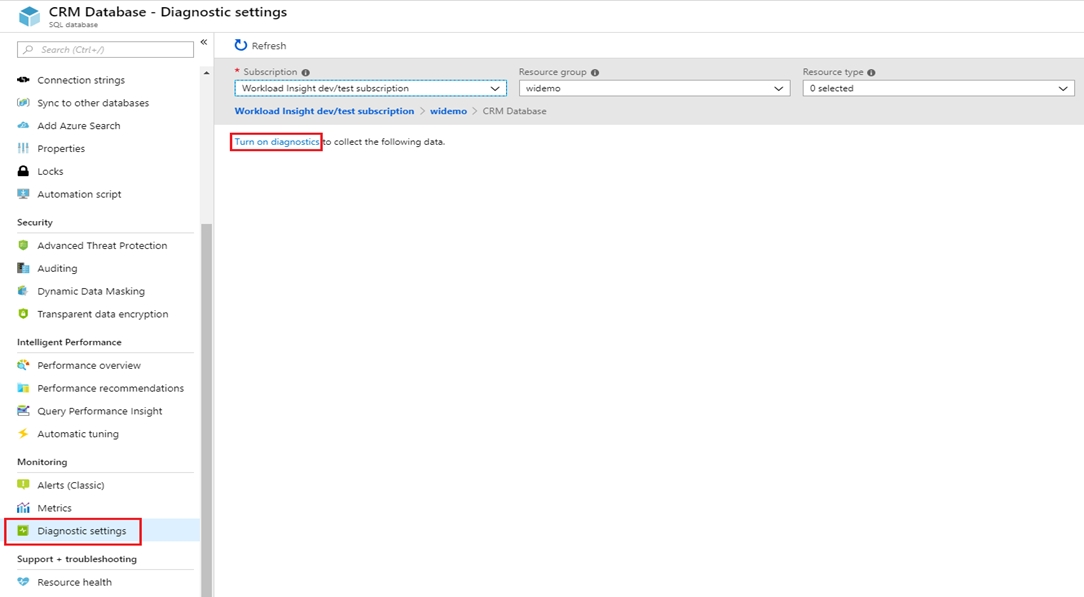
5. Enter a setting name for your own reference.
6. Select a destination resource for the streaming diagnostics data: Archive to storage account, Stream to an event hub, or Send to Log Analytics.
7. For the standard, event-based monitoring experience, select the following check boxes for database diagnostics log telemetry: QueryStoreRuntimeStatistics
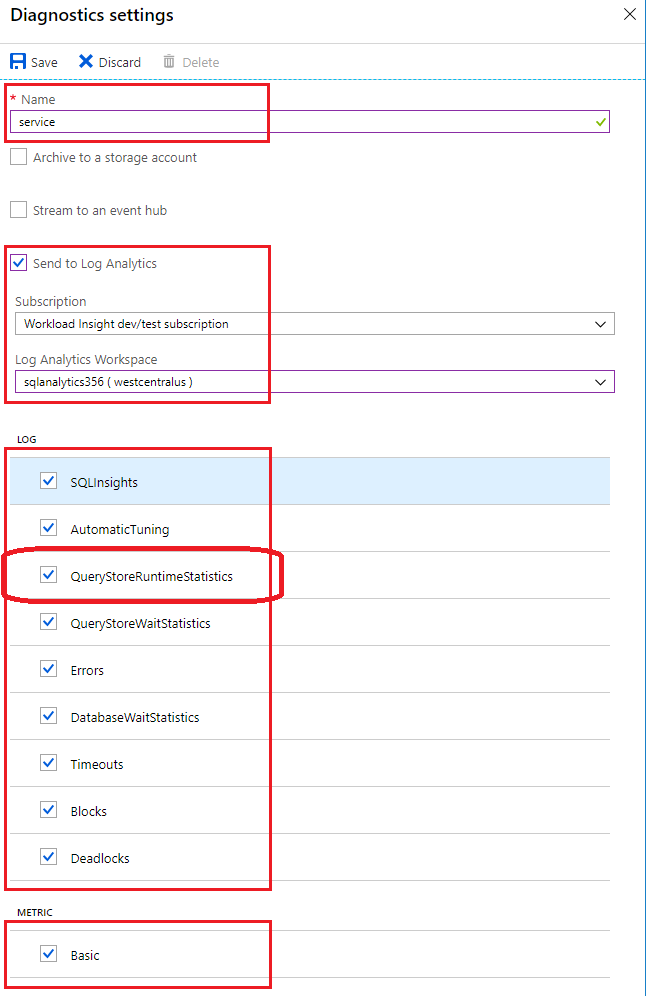
8. For an advanced, one-minute-based monitoring experience, select the check box for Basic metrics.
9. Select Save.
Reference:
https://docs.microsoft.com/en-us/azure/azure-sql/database/metrics-diagnostic-telemetry-logging-streaming-export-configure
See explanation below.
To enable streaming of diagnostic telemetry for a single or a pooled database, follow these steps:
1. Go to Azure SQL database resource.
2. Select Diagnostics settings.
3. Select Turn on diagnostics if no previous settings exist, or select Edit setting to edit a previous setting. You can create up to three parallel connections to stream diagnostic telemetry.
4. Select Add diagnostic setting to configure parallel streaming of diagnostics data to multiple resources.
5. Enter a setting name for your own reference.
6. Select a destination resource for the streaming diagnostics data: Archive to storage account, Stream to an event hub, or Send to Log Analytics.
7. For the standard, event-based monitoring experience, select the following check boxes for database diagnostics log telemetry: QueryStoreRuntimeStatistics
8. For an advanced, one-minute-based monitoring experience, select the check box for Basic metrics.
9. Select Save.
Reference:
https://docs.microsoft.com/en-us/azure/azure-sql/database/metrics-diagnostic-telemetry-logging-streaming-export-configure
Question #49
DRAG DROP -
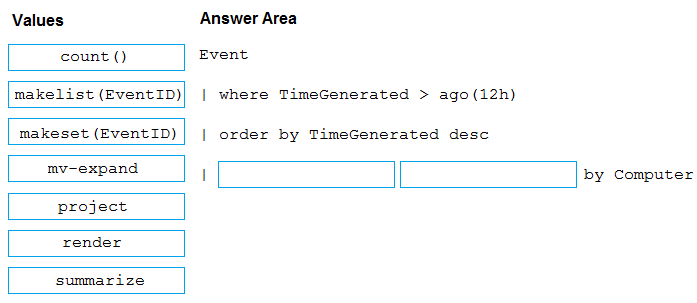
You have several Azure virtual machines that run Windows Server 2019.
You need to identify the distinct event IDs of each virtual machine as shown in the following table.
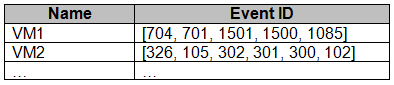
How should you complete the Azure Monitor query? To answer, drag the appropriate values to the correct locations. Each value may be used once, more than once, or not at all. You may need to drag the split bar between panes or scroll to view content.
NOTE: Each correct selection is worth one point.
Select and Place:
You have several Azure virtual machines that run Windows Server 2019.
You need to identify the distinct event IDs of each virtual machine as shown in the following table.
How should you complete the Azure Monitor query? To answer, drag the appropriate values to the correct locations. Each value may be used once, more than once, or not at all. You may need to drag the split bar between panes or scroll to view content.
NOTE: Each correct selection is worth one point.
Select and Place:
Correct Answer:
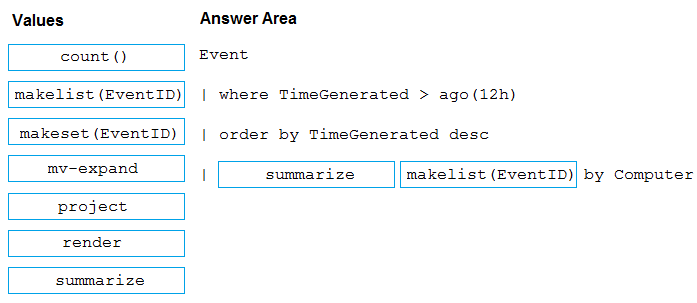
You can use makelist to pivot data by the order of values in a particular column. For example, you may want to explore the most common order events take place on your machines. You can essentially pivot the data by the order of EventIDs on each machine.
Example:
Event -
| where TimeGenerated > ago(12h)
| order by TimeGenerated desc
| summarize makelist(EventID) by Computer
Reference:
https://docs.microsoft.com/en-us/azure/azure-monitor/log-query/advanced-aggregations
Question #50
HOTSPOT -
You have an Azure web app named Webapp1.
You need to use an Azure Monitor query to create a report that details the top 10 pages of Webapp1 that failed.
How should you complete the query? To answer, select the appropriate options in the answer area.
NOTE: Each correct selection is worth one point.
Hot Area:
Correct Answer:
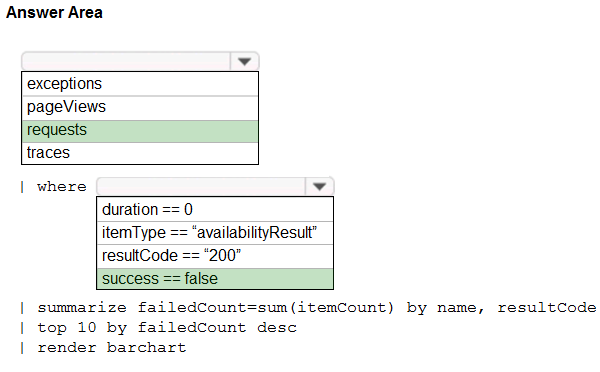
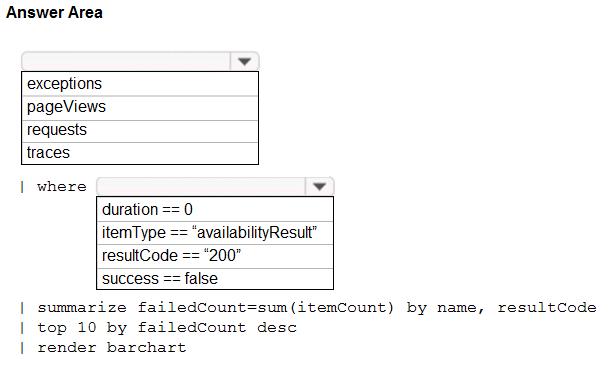
Box 1: requests -
Failed requests (requests/failed):
The count of tracked server requests that were marked as failed.
Kusto code:
requests
| where success == 'False'
Box 2: success == false -
Reference:
https://docs.microsoft.com/en-us/azure/azure-monitor/platform/app-insights-metrics
Box 1: requests -
Failed requests (requests/failed):
The count of tracked server requests that were marked as failed.
Kusto code:
requests
| where success == 'False'
Box 2: success == false -
Reference:
https://docs.microsoft.com/en-us/azure/azure-monitor/platform/app-insights-metrics
All Pages