Microsoft AZ-400 Exam Practice Questions (P. 4)
- Full Access (565 questions)
- One Year of Premium Access
- Access to one million comments
- Seamless ChatGPT Integration
- Ability to download PDF files
- Anki Flashcard files for revision
- No Captcha & No AdSense
- Advanced Exam Configuration
Question #32
DRAG DROP -
You need to recommend project metrics for dashboards in Azure DevOps.
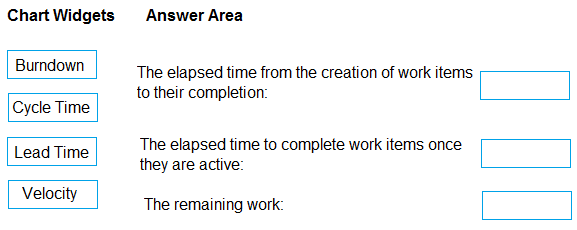
Which chart widgets should you recommend for each metric? To answer, drag the appropriate chart widgets to the correct metrics. Each chart widget may be used once, more than once, or not at all. You may need to drag the split bar between panes or scroll to view content.
NOTE: Each correct selection is worth one point.
Select and Place:
You need to recommend project metrics for dashboards in Azure DevOps.
Which chart widgets should you recommend for each metric? To answer, drag the appropriate chart widgets to the correct metrics. Each chart widget may be used once, more than once, or not at all. You may need to drag the split bar between panes or scroll to view content.
NOTE: Each correct selection is worth one point.
Select and Place:
Correct Answer:
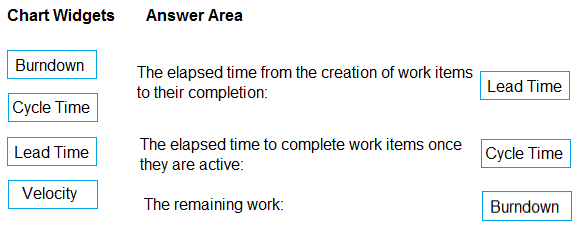
Box 1: Lead time -
Lead time measures the total time elapsed from the creation of work items to their completion.
Box 2: Cycle time -
Cycle time measures the time it takes for your team to complete work items once they begin actively working on them.
Box 3: Burndown -
Burndown charts focus on remaining work within a specific time period.
Incorrect Answers:
Velocity provides a useful metric for these activities:
Support sprint planning -
Forecast future sprints and the backlog items that can be completed
A guide for determining how well the team estimates and meets their planned commitments
Reference:
https://docs.microsoft.com/en-us/azure/devops/report/dashboards/velocity-guidance?view=vsts https://docs.microsoft.com/en-us/azure/devops/report/dashboards/cycle-time-and-lead-time?view=vsts https://docs.microsoft.com/en-us/azure/devops/report/dashboards/configure-burndown-burnup-widgets?view=vsts
Question #33
HOTSPOT -
You plan to create alerts that will be triggered based on the page load performance of a home page.
You have the Application Insights log query shown in the following exhibit.
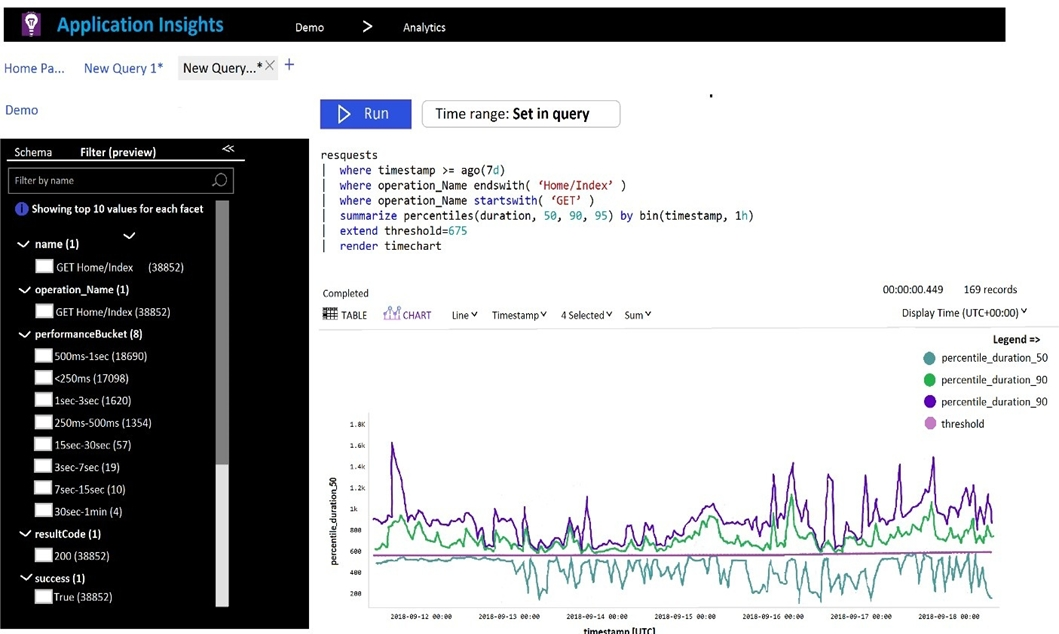
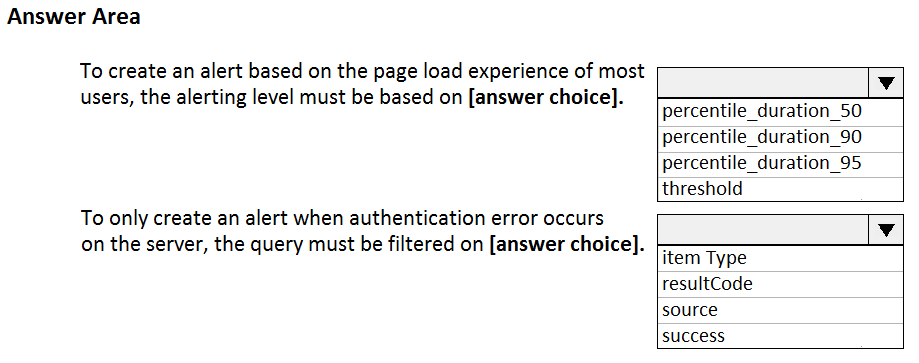
Use the drop-down menus to select the answer choice that completes each statement based on the information presented in the graphic.
NOTE: Each correct selection is worth one point.
Hot Area:
You plan to create alerts that will be triggered based on the page load performance of a home page.
You have the Application Insights log query shown in the following exhibit.
Use the drop-down menus to select the answer choice that completes each statement based on the information presented in the graphic.
NOTE: Each correct selection is worth one point.
Hot Area:
Correct Answer:
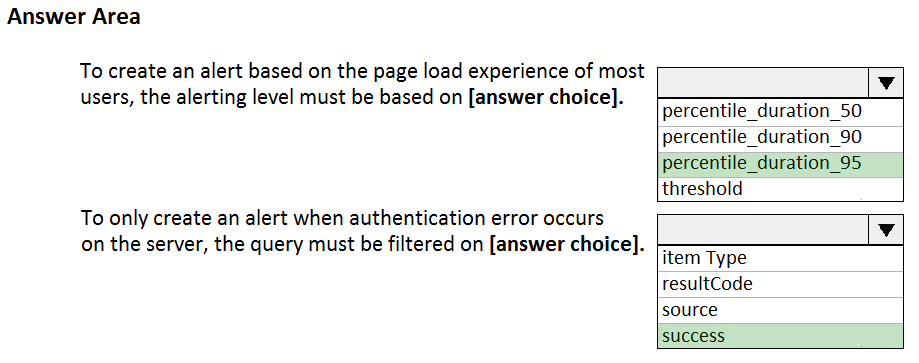
Box 1: percentile_duration_95 -
Box 2: success -
For example ג€"
requests
| project name, url, success
| where success == "False"
This will return all the failed requests in my App Insights within the specified time range.
Reference:
https://devblogs.microsoft.com/premier-developer/alerts-based-on-analytics-query-using-custom-log-search/
Question #35
HOTSPOT -
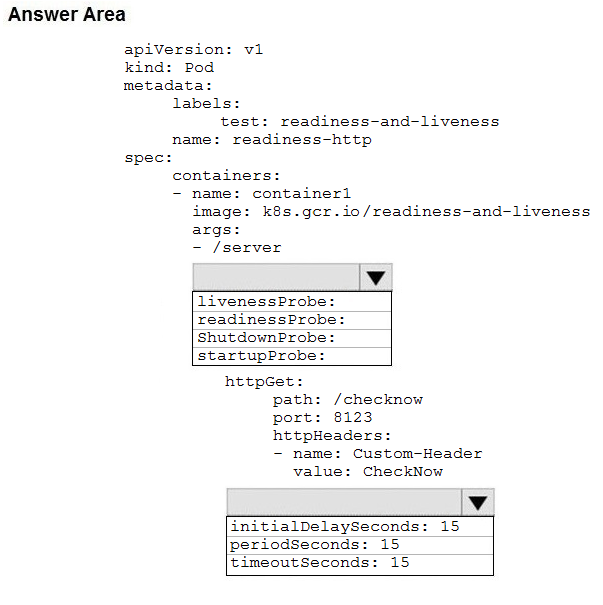
You have an Azure Kubernetes Service (AKS) pod.
You need to configure a probe to perform the following actions:
✑ Confirm that the pod is responding to service requests.
✑ Check the status of the pod four times a minute.
✑ Initiate a shutdown if the pod is unresponsive.
How should you complete the YAML configuration file? To answer, select the appropriate options in the answer area.
NOTE: Each correct selection is worth one point.
Hot Area:
Correct Answer:
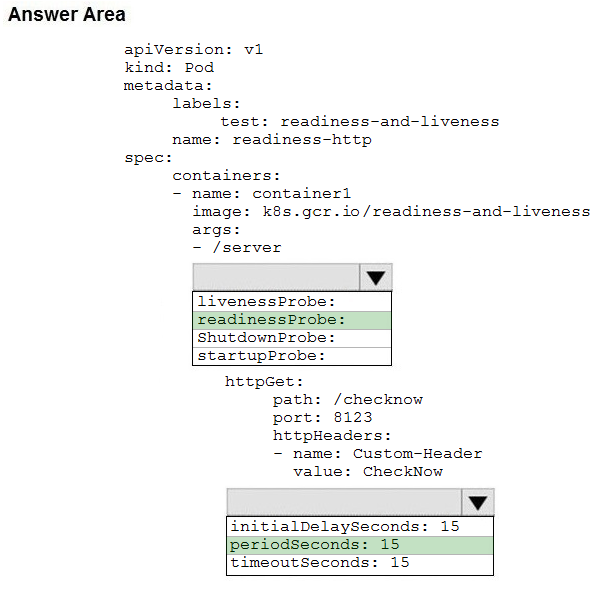
Box 1: readinessProbe:
For containerized applications that serve traffic, you might want to verify that your container is ready to handle incoming requests. Azure Container Instances supports readiness probes to include configurations so that your container can't be accessed under certain conditions.
Incorrect Answers:
livenessProbe: Containerized applications may run for extended periods of time, resulting in broken states that may need to be repaired by restarting the container. Azure Container Instances supports liveness probes so that you can configure your containers within your container group to restart if critical functionality is not working.
Box 2: periodSeconds: 15 -
The periodSeconds property designates the readiness command should execute every 15 seconds.
Reference:
https://docs.microsoft.com/en-us/azure/container-instances/container-instances-readiness-probe
Question #36
You have a Microsoft ASP.NET Core web app in Azure that is accessed worldwide.
You need to run a URL ping test once every five minutes and create an alert when the web app is unavailable from specific Azure regions. The solution must minimize development time.
What should you do?
You need to run a URL ping test once every five minutes and create an alert when the web app is unavailable from specific Azure regions. The solution must minimize development time.
What should you do?
- ACreate an Azure Monitor Availability metric and alert.
- BCreate an Azure Application Insights availability test and alert.
- CWrite an Azure function and deploy the function to the specific regions.
- DCreate an Azure Service Health alert for the specific regions.
Correct Answer:
B
There are three types of Application Insights availability tests:
URL ping test: a simple test that you can create in the Azure portal.

✑ Multi-step web test
✑ Custom Track Availability Tests
Note: After you've deployed your web app/website, you can set up recurring tests to monitor availability and responsiveness. Azure Application Insights sends web requests to your application at regular intervals from points around the world. It can alert you if your application isn't responding, or if it responds too slowly.
You can set up availability tests for any HTTP or HTTPS endpoint that is accessible from the public internet. You don't have to make any changes to the website you're testing. In fact, it doesn't even have to be a site you own. You can test the availability of a REST API that your service depends on.
Reference:
https://docs.microsoft.com/en-us/azure/azure-monitor/app/monitor-web-app-availability#create-a-url-ping-test
B
There are three types of Application Insights availability tests:
URL ping test: a simple test that you can create in the Azure portal.
✑ Multi-step web test
✑ Custom Track Availability Tests
Note: After you've deployed your web app/website, you can set up recurring tests to monitor availability and responsiveness. Azure Application Insights sends web requests to your application at regular intervals from points around the world. It can alert you if your application isn't responding, or if it responds too slowly.
You can set up availability tests for any HTTP or HTTPS endpoint that is accessible from the public internet. You don't have to make any changes to the website you're testing. In fact, it doesn't even have to be a site you own. You can test the availability of a REST API that your service depends on.
Reference:
https://docs.microsoft.com/en-us/azure/azure-monitor/app/monitor-web-app-availability#create-a-url-ping-test
Question #38
SIMULATION -
You need to create an instance of Azure Application Insights named az400-123456789-main and configure the instance to receive telemetry data from an Azure web app named az400-123456789-main.
To complete this task, sign in to the Microsoft Azure portal.
You need to create an instance of Azure Application Insights named az400-123456789-main and configure the instance to receive telemetry data from an Azure web app named az400-123456789-main.
To complete this task, sign in to the Microsoft Azure portal.
Correct Answer:
See explanation below.
Step 1: Create an instance of Azure Application Insights
1. Open Microsoft Azure Portal
2. Log into your Azure account, Select Create a resource > Developer tools > Application Insights.
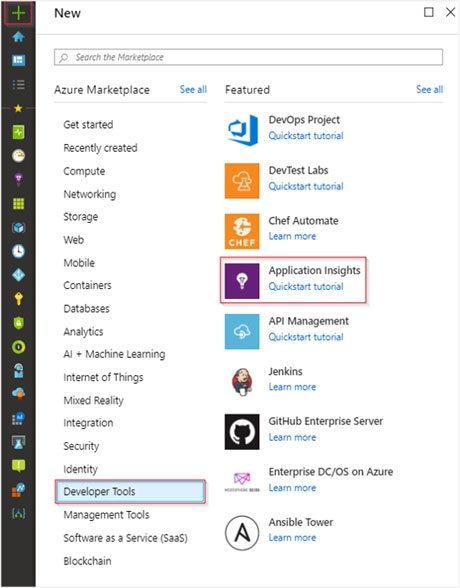
3. Enter the following settings, and then select Review + create.
Name: az400-123456789-main -
Step 2: Configure App Insights SDK
1. Open your ASP.NET Core Web App project in Visual Studio > Right-click on the AppName in the Solution Explorer > Select Add > Application Insights
Telemetry.
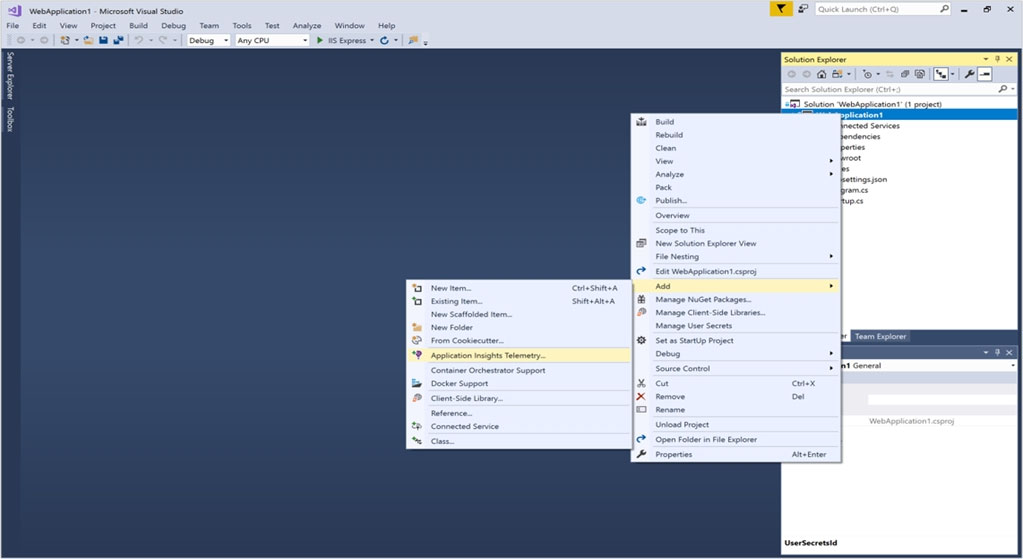
2. Click the Get Started button
3. Select your account and subscription > Select the Existing resource you created in the Azure portal > Click Register.
Reference:
https://docs.microsoft.com/bs-latn-ba/azure/azure-monitor/learn/dotnetcore-quick-start?view=vs-2017
See explanation below.
Step 1: Create an instance of Azure Application Insights
1. Open Microsoft Azure Portal
2. Log into your Azure account, Select Create a resource > Developer tools > Application Insights.
3. Enter the following settings, and then select Review + create.
Name: az400-123456789-main -
Step 2: Configure App Insights SDK
1. Open your ASP.NET Core Web App project in Visual Studio > Right-click on the AppName in the Solution Explorer > Select Add > Application Insights
Telemetry.
2. Click the Get Started button
3. Select your account and subscription > Select the Existing resource you created in the Azure portal > Click Register.
Reference:
https://docs.microsoft.com/bs-latn-ba/azure/azure-monitor/learn/dotnetcore-quick-start?view=vs-2017
Question #40
HOTSPOT -
Your company is building a new web application.
You plan to collect feedback from pilot users on the features being delivered.
All the pilot users have a corporate computer that has Google Chrome and the Microsoft Test & Feedback extension installed. The pilot users will test the application by using Chrome.
You need to identify which access levels are required to ensure that developers can request and gather feedback from the pilot users. The solution must use the principle of least privilege.
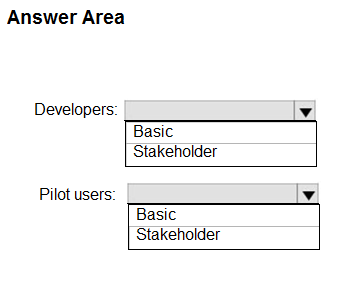
Which access levels in Azure DevOps should you identify? To answer, select the appropriate options in the answer area.
NOTE: Each correct selection is worth one point.
Hot Area:
Your company is building a new web application.
You plan to collect feedback from pilot users on the features being delivered.
All the pilot users have a corporate computer that has Google Chrome and the Microsoft Test & Feedback extension installed. The pilot users will test the application by using Chrome.
You need to identify which access levels are required to ensure that developers can request and gather feedback from the pilot users. The solution must use the principle of least privilege.
Which access levels in Azure DevOps should you identify? To answer, select the appropriate options in the answer area.
NOTE: Each correct selection is worth one point.
Hot Area:
Correct Answer:
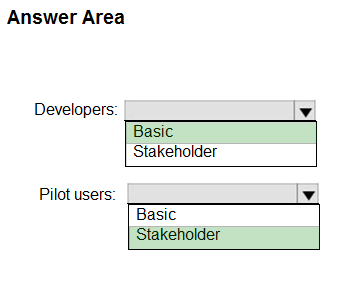
Box 1: Basic -
Assign Basic to users with a TFS CAL, with a Visual Studio Professional subscription, and to users for whom you are paying for Azure Boards & Repos in an organization.
Box 2: Stakeholder -
Assign Stakeholders to users with no license or subscriptions who need access to a limited set of features.
Note:
You assign users or groups of users to one of the following access levels:
Basic: provides access to most features
VS Enterprise: provides access to premium features
Stakeholders: provides partial access, can be assigned to unlimited users for free
Reference:
https://docs.microsoft.com/en-us/azure/devops/organizations/security/access-levels?view=vsts
All Pages