Microsoft 70-779 Exam Practice Questions (P. 4)
- Full Access (98 questions)
- One Year of Premium Access
- Access to one million comments
- Seamless ChatGPT Integration
- Ability to download PDF files
- Anki Flashcard files for revision
- No Captcha & No AdSense
- Advanced Exam Configuration
Question #17
DRAG DROP -
You need to create a PivotChart as shown in the exhibit. (Click the Exhibit button.)
Exhibit:
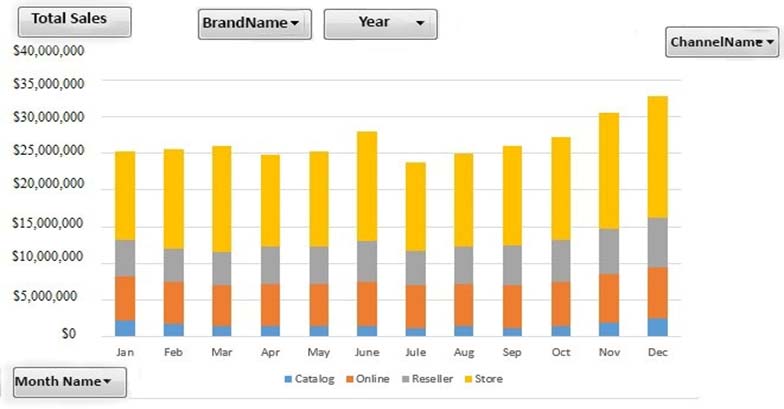
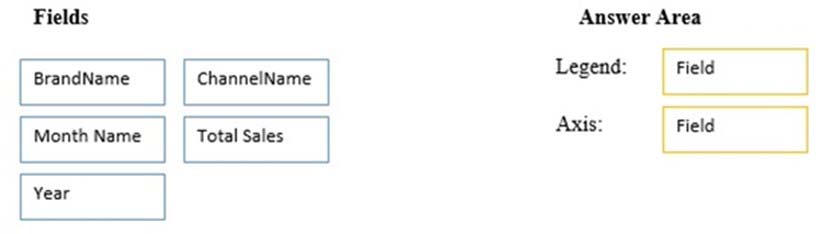
Which field should you use for each area? To answer, drag the appropriate fields to the correct areas. Each field may be used once, more than once, or not at all.
You may need to drag the split bar between panes or scroll to view content.
NOTE: Each correct selection is worth one point.
Select and Place:
You need to create a PivotChart as shown in the exhibit. (Click the Exhibit button.)
Exhibit:
Which field should you use for each area? To answer, drag the appropriate fields to the correct areas. Each field may be used once, more than once, or not at all.
You may need to drag the split bar between panes or scroll to view content.
NOTE: Each correct selection is worth one point.
Select and Place:
Question #18
DRAG DROP -
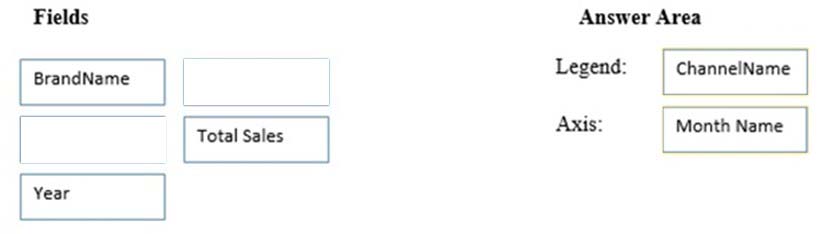
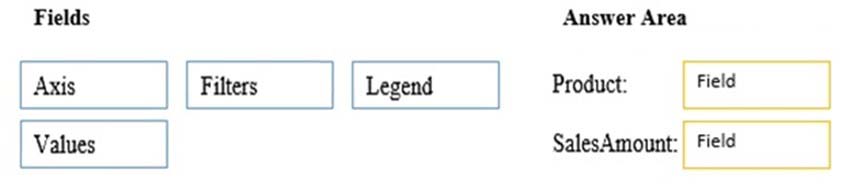
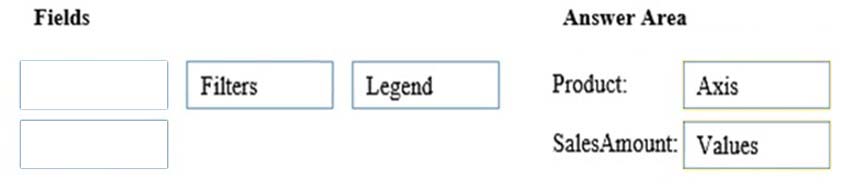
You create the PivotChart shown in the exhibit. (Click the Exhibit button.)
Exhibit:
In which area is Product and in which area is SalesAmount? To answer, drag the appropriate fields to the correct areas. Each field may be used once, more than once, or not at all. You may need to drag the split bar between panes or scroll to view content.
NOTE: Each correct selection is worth one point.
Select and Place:
Question #19
Note: This question is part of a series of questions that use the same scenario. For your convenience, the scenario is repeated in each question. Each question presents a different goal and answer choices, but the text of the scenario is the same in each question in this series.
Start of repeated scenario.
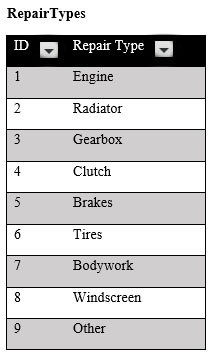
You are creating reports for a car repair company. You have four datasets in Excel spreadsheets. Four workbook queries load the datasets to a data model. A sample of the data is shown in the Data Sample exhibit. (Click the Exhibit button.)
Data Sample exhibit:

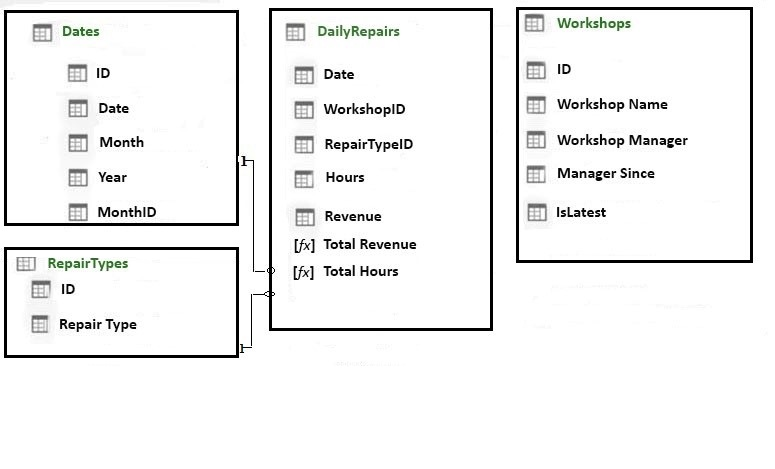
The data model is shown in the Data Model exhibit. (Click the Exhibit button.)
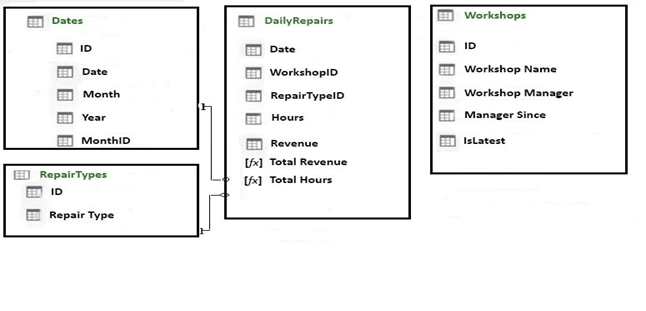
The tables in the model contain the following data:
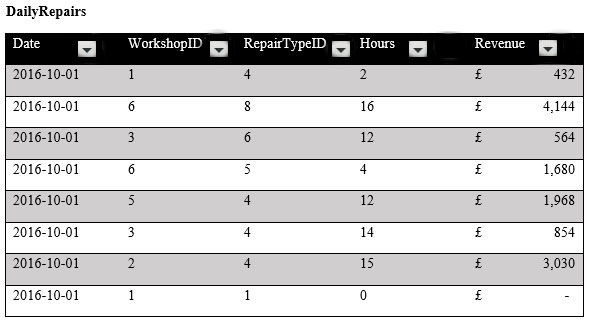
✑ DailyRepairs has a log of hours and revenue for each day, workshop, and repair type. Every day, a log entry is created for each workshop, even if no hours or revenue are recorded for that day. Total Hours and Total Revenue column.
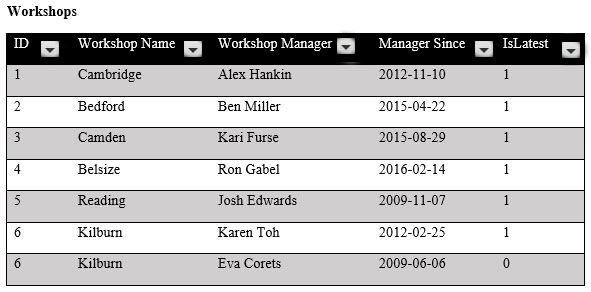
✑ Workshops have a list of all the workshops and the current and previous workshop managers. The format of the Workshop Manager column is always
Firstname Lastname. A value of 1 in the IsLatest column indicates that the workshop manager listed in the record is the current workshop manager.
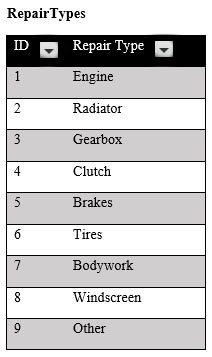
✑ RepairTypes has a list of all the repair types
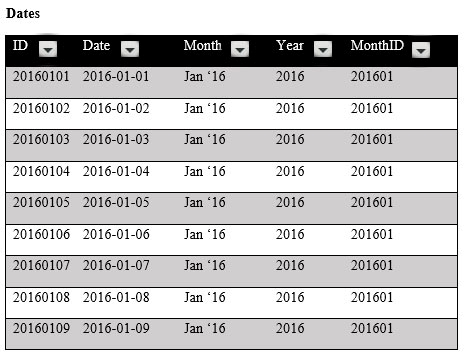
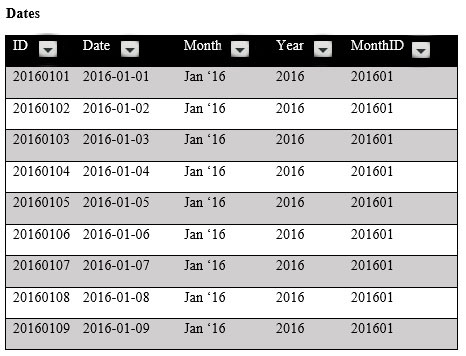
✑ Dates has a list of dates from 2015 to 2018
End of repeated scenario.
When you attempt to create a relationship between DailyRepairs and Workshops, Power Pivot generates the following error message: "The relationship cannot be created because each column contains duplicate values. Select at least one column that contains only unique values".
You need to ensure that you can create a valid relationship between the tables.
What should you do?
Start of repeated scenario.
You are creating reports for a car repair company. You have four datasets in Excel spreadsheets. Four workbook queries load the datasets to a data model. A sample of the data is shown in the Data Sample exhibit. (Click the Exhibit button.)
Data Sample exhibit:
The data model is shown in the Data Model exhibit. (Click the Exhibit button.)
The tables in the model contain the following data:
✑ DailyRepairs has a log of hours and revenue for each day, workshop, and repair type. Every day, a log entry is created for each workshop, even if no hours or revenue are recorded for that day. Total Hours and Total Revenue column.
✑ Workshops have a list of all the workshops and the current and previous workshop managers. The format of the Workshop Manager column is always
Firstname Lastname. A value of 1 in the IsLatest column indicates that the workshop manager listed in the record is the current workshop manager.
✑ RepairTypes has a list of all the repair types
✑ Dates has a list of dates from 2015 to 2018
End of repeated scenario.
When you attempt to create a relationship between DailyRepairs and Workshops, Power Pivot generates the following error message: "The relationship cannot be created because each column contains duplicate values. Select at least one column that contains only unique values".
You need to ensure that you can create a valid relationship between the tables.
What should you do?
Question #20
DRAG DROP -
Note: This question is part of a series of questions that use the same scenario. For your convenience, the scenario is repeated in each question. Each question presents a different goal and answer choices, but the text of the scenario is the same in each question in this series.
Start of repeated scenario.
You are creating reports for a car repair company. You have four datasets in Excel spreadsheets. Four workbook queries load the datasets to a data model. A sample of the data is shown in the Data Sample exhibit. (Click the Exhibit button.)
Data Sample exhibit:

The data model is shown in the Data Model exhibit. (Click the Exhibit button.)
The tables in the model contain the following data:
✑ DailyRepairs has a log of hours and revenue for each day, workshop, and repair type. Every day, a log entry is created for each workshop, even if no hours or revenue are recorded for that day. Total Hours and Total Revenue column.
✑ Workshops have a list of all the workshops and the current and previous workshop managers. The format of the Workshop Manager column is always
Firstname Lastname. A value of 1 in the IsLatest column indicates that the workshop manager listed in the record is the current workshop manager.
✑ RepairTypes has a list of all the repair types
✑ Dates has a list of dates from 2015 to 2018
End of repeated scenario.
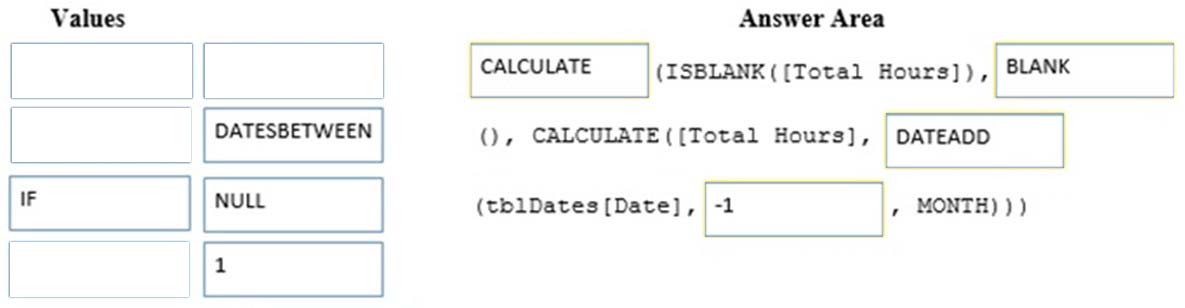
You need to create a PivotChart that displays the month, the hours of the month, and the hours of the previous month, as shown in the following exhibit.
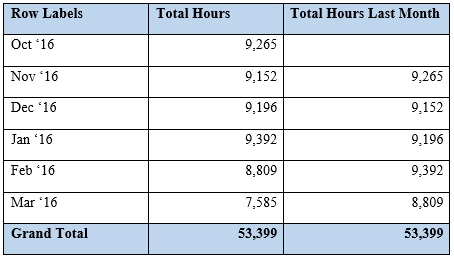
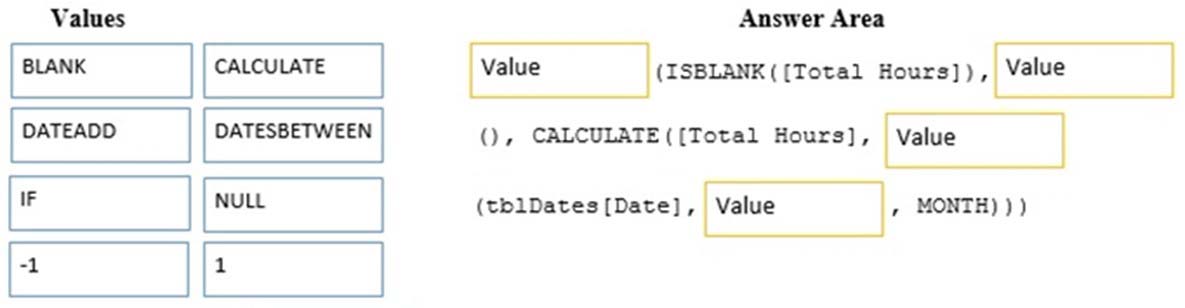
Which DAX formula should you use for the Total Hours Last Month measure? To answer, drag the appropriate fields to the correct targets. Each value may be used once, more than once, or not at all. You may need to drag the split bar between panes or scroll to view content.
NOTE: Each correct selection is worth one point.
Select and Place:
Note: This question is part of a series of questions that use the same scenario. For your convenience, the scenario is repeated in each question. Each question presents a different goal and answer choices, but the text of the scenario is the same in each question in this series.
Start of repeated scenario.
You are creating reports for a car repair company. You have four datasets in Excel spreadsheets. Four workbook queries load the datasets to a data model. A sample of the data is shown in the Data Sample exhibit. (Click the Exhibit button.)
Data Sample exhibit:
The data model is shown in the Data Model exhibit. (Click the Exhibit button.)
The tables in the model contain the following data:
✑ DailyRepairs has a log of hours and revenue for each day, workshop, and repair type. Every day, a log entry is created for each workshop, even if no hours or revenue are recorded for that day. Total Hours and Total Revenue column.
✑ Workshops have a list of all the workshops and the current and previous workshop managers. The format of the Workshop Manager column is always
Firstname Lastname. A value of 1 in the IsLatest column indicates that the workshop manager listed in the record is the current workshop manager.
✑ RepairTypes has a list of all the repair types
✑ Dates has a list of dates from 2015 to 2018
End of repeated scenario.
You need to create a PivotChart that displays the month, the hours of the month, and the hours of the previous month, as shown in the following exhibit.
Which DAX formula should you use for the Total Hours Last Month measure? To answer, drag the appropriate fields to the correct targets. Each value may be used once, more than once, or not at all. You may need to drag the split bar between panes or scroll to view content.
NOTE: Each correct selection is worth one point.
Select and Place:
Correct Answer:
References:
https://technet.microsoft.com/en-us/library/ee634204(v=sql.105).aspx https://msdn.microsoft.com/en-us/library/ee634905.aspx
References:
https://technet.microsoft.com/en-us/library/ee634204(v=sql.105).aspx https://msdn.microsoft.com/en-us/library/ee634905.aspx
All Pages