Microsoft 70-779 Exam Practice Questions (P. 3)
- Full Access (98 questions)
- Six months of Premium Access
- Access to one million comments
- Seamless ChatGPT Integration
- Ability to download PDF files
- Anki Flashcard files for revision
- No Captcha & No AdSense
- Advanced Exam Configuration
Question #11
You have a table that contains the following data.

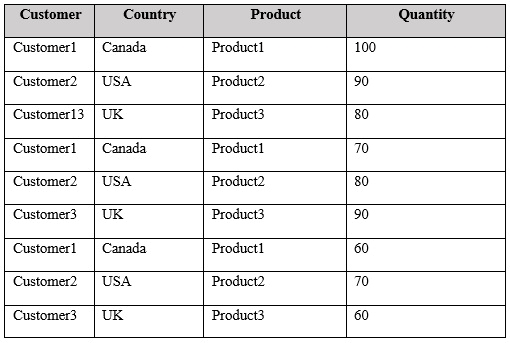
You need to create a PivotTable as shown in the exhibit. (Click the Exhibit button.)

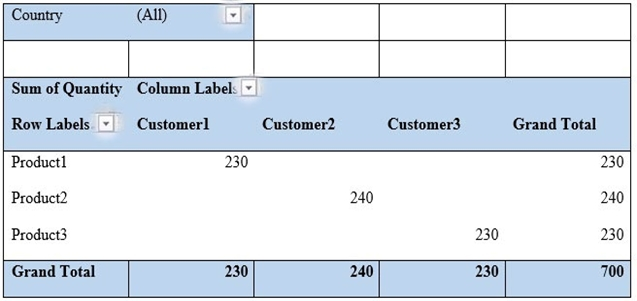
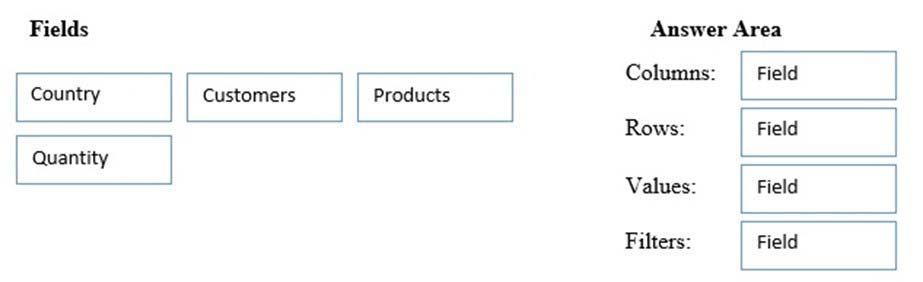
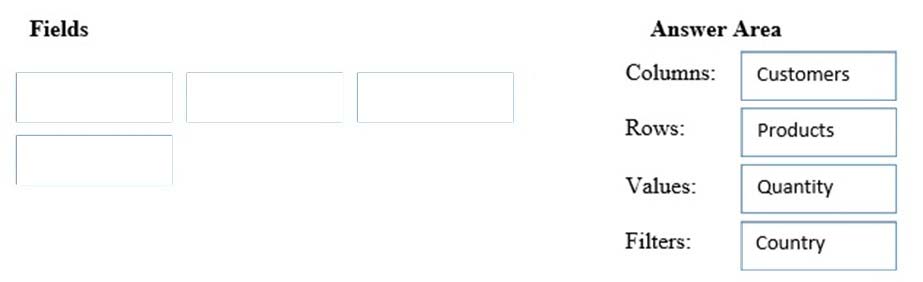
How should you configure the PivotTable? To answer, drag the appropriate fields to the correct areas. Each field may be used once, more than once, or not at all.
You may need to drag the split bar between panes or scroll to view content.
NOTE: Each correct selection is worth one point.
Select and Place:


Hi! Do you need help with this question ?
- Why isn't the A the right answer?
- Traducir la pregunta al español
Contributor get free access to an augmented ChatGPT 4 trained with the latest IT Questions.
Question #12
You need to visualize the exam data by separating the data into quartiles. The visualization must display the mean score and must identify any outliers.
Which type of chart should you use?
- Aline
- Bpie
- Cbox and whisker
- Dhistogram
C
References:
https://support.office.com/en-us/article/create-a-box-and-whisker-chart-62f4219f-db4b-4754-aca8-4743f6190f0d

Hi! Do you need help with this question ?
- Why isn't the A the right answer?
- Traducir la pregunta al español
Contributor get free access to an augmented ChatGPT 4 trained with the latest IT Questions.
Question #13
You need to modify Goal to multiply the sales from the previous year by 1.15.
What should you do?
- AFrom Power Pivot, modify the measure
- BFrom Power Pivot, create a new calculated column, and then modify the KPI
- CFrom the properties of the KPI, modify the absolute value
- DFrom the properties of the KPI, modify the KPI base field
D
References:
https://support.office.com/en-us/article/key-performance-indicators-kpis-in-power-view-230d7f15-731e-47a5-9938-fa0f02e6b676#__toc351738129

Hi! Do you need help with this question ?
- Why isn't the A the right answer?
- Traducir la pregunta al español
Contributor get free access to an augmented ChatGPT 4 trained with the latest IT Questions.
Question #14
You install Microsoft Power BI Publisher for Excel.
You need to add a tile for the PivotChart to a Power BI dashboard.
What should you do?
- AFrom powerbi.com, click Get apps
- BFrom powerbi.com, upload the Excel workbook
- CFrom the File menu in Excel, click Publish
- DFrom the Power BI tab in Excel, click Pin
C
References:
https://docs.microsoft.com/en-us/power-bi/service-publish-from-excel

Hi! Do you need help with this question ?
- Why isn't the A the right answer?
- Traducir la pregunta al español
Contributor get free access to an augmented ChatGPT 4 trained with the latest IT Questions.
Question #15
You plan to publish the workbook to the Power BI service.
Users will use Q&A in the Power BI service to perform natural language queries.
You need to ensure that the users can query the term employee and receive results from the User table.
What should you do before you publish to Power BI?
- AFrom PowerPivot Settings, modify the Language options
- BFrom PowerPivot Settings, modify the Categorization options
- CFrom the Power Pivot model, edit the Synonyms
- DFrom Workbook Connections, add a connection
C
References:
http://blog.pragmaticworks.com/optimizing-power-bi-qa-with-synonyms-phrasing-using-cloud-modeling

Hi! Do you need help with this question ?
- Why isn't the A the right answer?
- Traducir la pregunta al español
Contributor get free access to an augmented ChatGPT 4 trained with the latest IT Questions.
All Pages