Microsoft 70-779 Exam Practice Questions (P. 2)
- Full Access (98 questions)
- One Year of Premium Access
- Access to one million comments
- Seamless ChatGPT Integration
- Ability to download PDF files
- Anki Flashcard files for revision
- No Captcha & No AdSense
- Advanced Exam Configuration
Question #6
Note: This question is part of a series of questions that present the same scenario. Each question in the series contains a unique solution that might meet the stated goals. Some question sets might have more than one correct solution, while others might not have a correct solution.
After you answer a question in this section, you will NOT be able to return to it. As a result, these questions will not appear in the review screen.
You have a Power Pivot model that contains the following tables.
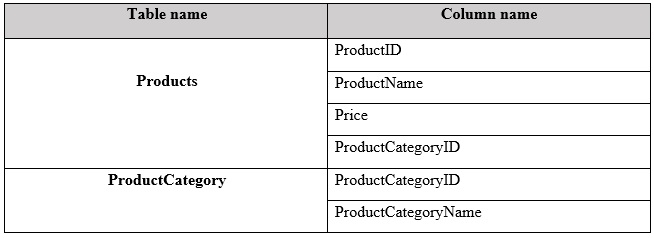
There is a relationship between Products and ProductCategory.
You need to create a hierarchy in Products that contains ProductCategoryName and ProductName.
Solution: You create a measure that uses the ISCROSSFILTERED DAX function
Does this meet the goal?
After you answer a question in this section, you will NOT be able to return to it. As a result, these questions will not appear in the review screen.
You have a Power Pivot model that contains the following tables.
There is a relationship between Products and ProductCategory.
You need to create a hierarchy in Products that contains ProductCategoryName and ProductName.
Solution: You create a measure that uses the ISCROSSFILTERED DAX function
Does this meet the goal?
Question #7
HOTSPOT -
Note: This question is part of a series of questions that use the same scenario. For your convenience, the scenario is repeated in each question. Each question presents a different goal and answer choices, but the text of the scenario is the same in each question in this series.
Start of repeated scenario.
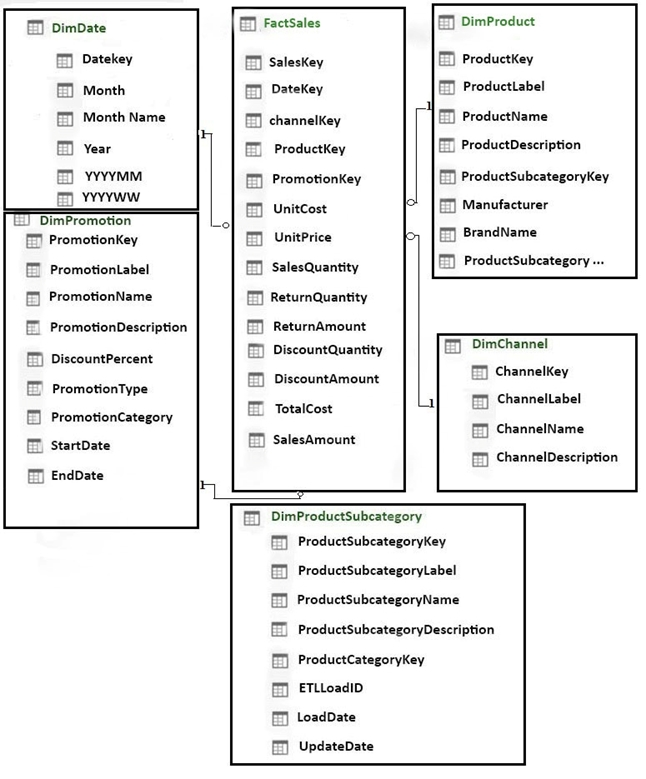
You have six workbook queries that each extracts a table from a Microsoft Azure SQL database. The tables are loaded to the data model, but the data is not loaded to any worksheets. The data model is shown in the Data Model exhibit. (Click the Exhibit button.)
Exhibit:

Your company has 100 product subcategories and more than 10,000 products.
End of repeated scenario.
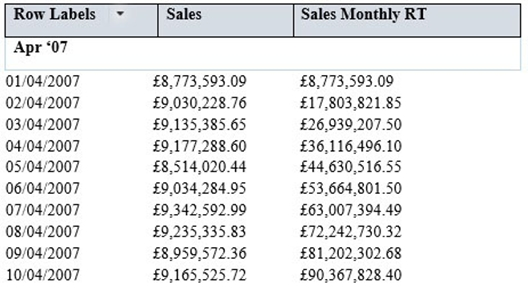
You need to create a measure named [Sales Monthly RT] that calculates a running total of [Sales] for each date within a month as shown in the following exhibit.
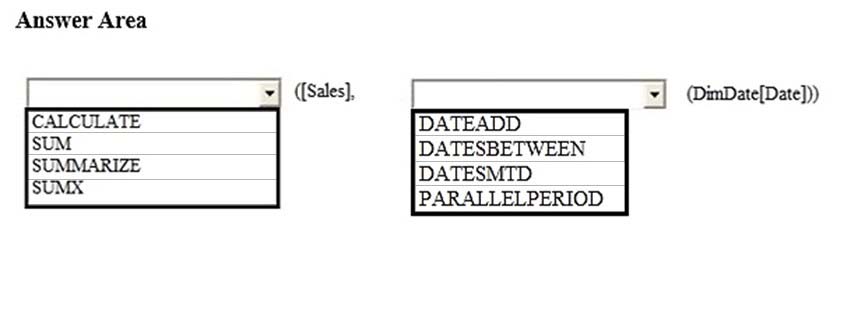
How should you complete the DAX formula? To answer, select the appropriate options in the answer area.
NOTE: Each correct selection is worth one point.
Hot Area:
Note: This question is part of a series of questions that use the same scenario. For your convenience, the scenario is repeated in each question. Each question presents a different goal and answer choices, but the text of the scenario is the same in each question in this series.
Start of repeated scenario.
You have six workbook queries that each extracts a table from a Microsoft Azure SQL database. The tables are loaded to the data model, but the data is not loaded to any worksheets. The data model is shown in the Data Model exhibit. (Click the Exhibit button.)
Exhibit:
Your company has 100 product subcategories and more than 10,000 products.
End of repeated scenario.
You need to create a measure named [Sales Monthly RT] that calculates a running total of [Sales] for each date within a month as shown in the following exhibit.
How should you complete the DAX formula? To answer, select the appropriate options in the answer area.
NOTE: Each correct selection is worth one point.
Hot Area:
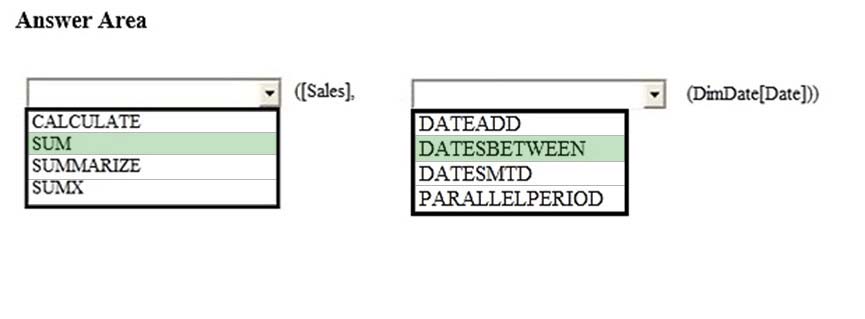
Correct Answer:
References:
https://msdn.microsoft.com/en-us/library/ee634557.aspx
http://radacad.com/previous-dynamic-period-dax-calculation
References:
https://msdn.microsoft.com/en-us/library/ee634557.aspx
http://radacad.com/previous-dynamic-period-dax-calculation
Question #8
DRAG DROP -
Note: This question is part of a series of questions that use the same scenario. For your convenience, the scenario is repeated in each question. Each question presents a different goal and answer choices, but the text of the scenario is the same in each question in this series.
Start of repeated scenario.
You have six workbook queries that each extracts a table from a Microsoft Azure SQL database. The tables are loaded to the data model, but the data is not loaded to any worksheets. The data model is shown in the Data Model exhibit. (Click the Exhibit button.)
Exhibit:
Your company has 100 product subcategories and more than 10,000 products.
End of repeated scenario.
You need to create a chart as shown in the following exhibit.
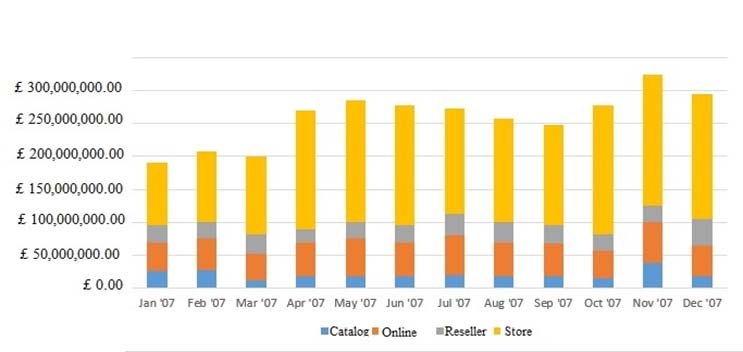
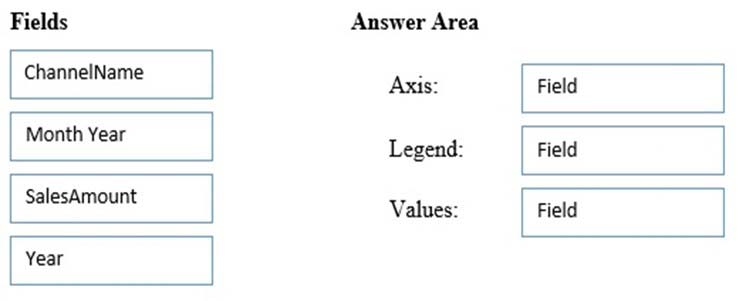
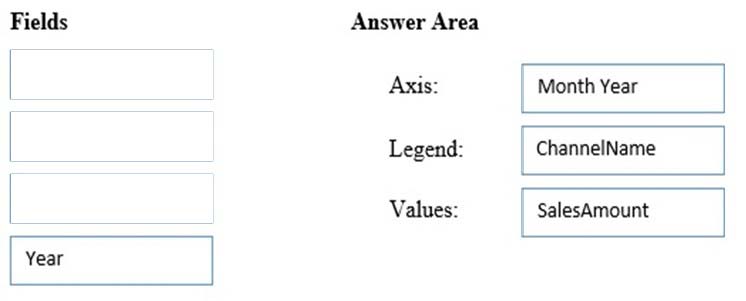
Which field should you use for each area? To answer, drag the appropriate fields to the correct areas. Each field may be used once, more than once, or not at all.
You may need to drag the split bar between panes or scroll to view content.
NOTE: Each correct selection is worth one point.
Select and Place:
Note: This question is part of a series of questions that use the same scenario. For your convenience, the scenario is repeated in each question. Each question presents a different goal and answer choices, but the text of the scenario is the same in each question in this series.
Start of repeated scenario.
You have six workbook queries that each extracts a table from a Microsoft Azure SQL database. The tables are loaded to the data model, but the data is not loaded to any worksheets. The data model is shown in the Data Model exhibit. (Click the Exhibit button.)
Exhibit:
Your company has 100 product subcategories and more than 10,000 products.
End of repeated scenario.
You need to create a chart as shown in the following exhibit.
Which field should you use for each area? To answer, drag the appropriate fields to the correct areas. Each field may be used once, more than once, or not at all.
You may need to drag the split bar between panes or scroll to view content.
NOTE: Each correct selection is worth one point.
Select and Place:
Question #9
Note: This question is part of a series of questions that use the same scenario. For your convenience, the scenario is repeated in each question. Each question presents a different goal and answer choices, but the text of the scenario is the same in each question in this series.
Start of repeated scenario.
You have six workbook queries that each extracts a table from a Microsoft Azure SQL database. The tables are loaded to the data model, but the data is not loaded to any worksheets. The data model is shown in the Data Model exhibit. (Click the Exhibit button.)
Exhibit:

Your company has 100 product subcategories and more than 10,000 products.
End of repeated scenario.
You need to create a simplified view of the workbook for some users. The simplified view must only display data from FactSales, DimProduct, and DimDate.
What should you do in the data model?
Start of repeated scenario.
You have six workbook queries that each extracts a table from a Microsoft Azure SQL database. The tables are loaded to the data model, but the data is not loaded to any worksheets. The data model is shown in the Data Model exhibit. (Click the Exhibit button.)
Exhibit:
Your company has 100 product subcategories and more than 10,000 products.
End of repeated scenario.
You need to create a simplified view of the workbook for some users. The simplified view must only display data from FactSales, DimProduct, and DimDate.
What should you do in the data model?
Question #10
Note: This question is part of a series of questions that use the same scenario. For your convenience, the scenario is repeated in each question. Each question presents a different goal and answer choices, but the text of the scenario is the same in each question in this series.
Start of repeated scenario.
You have six workbook queries that each extracts a table from a Microsoft Azure SQL database. The tables are loaded to the data model, but the data is not loaded to any worksheets. The data model is shown in the Data Model exhibit. (Click the Exhibit button.)
Exhibit:

Your company has 100 product subcategories and more than 10,000 products.
End of repeated scenario.
You have a PivotChart that uses Manufacturer as the axis and the sum of SalesAmount as the values.
You need to ensure that only the top 10 manufacturers appear in the chart.
What should you do?
Start of repeated scenario.
You have six workbook queries that each extracts a table from a Microsoft Azure SQL database. The tables are loaded to the data model, but the data is not loaded to any worksheets. The data model is shown in the Data Model exhibit. (Click the Exhibit button.)
Exhibit:
Your company has 100 product subcategories and more than 10,000 products.
End of repeated scenario.
You have a PivotChart that uses Manufacturer as the axis and the sum of SalesAmount as the values.
You need to ensure that only the top 10 manufacturers appear in the chart.
What should you do?
All Pages