Microsoft 77-888 Exam Practice Questions (P. 3)
- Full Access (61 questions)
- Six months of Premium Access
- Access to one million comments
- Seamless ChatGPT Integration
- Ability to download PDF files
- Anki Flashcard files for revision
- No Captcha & No AdSense
- Advanced Exam Configuration
Question #11
Which of the following is used to display a trend based on adjacent data in a clear and compact graphical representation by taking up a small amount of space?
- ATrendline
- BLine chart
- CSparkline
- DBackstage view
Correct Answer:
C
A sparkline is defined as a tiny chart in the background of a cell. Unlike charts on an Excel Worksheet, sparklines are not objects. It is used because data presented in a row or column is useful, but patterns can be hard to spot at a glance. It is used to display a trend based on adjacent data in a clear and compact graphical representation by taking up a small amount of space.
The benefit of using the sparklines is that these can be printed when a user prints a worksheet that contains them. This feature is not available in charts.
Answer option D is incorrect. The Microsoft Office Backstage view is used to replace the traditional file menu with a new approach that uses In and Out features for efficiency. The improved Ribbon enables users to access their preferred commands rapidly and create custom tabs to personalize the way they work.
Answer option A is incorrect. A trendline is defined in Excel 2010. It is a data visualization tool to display the trend of a particular data range.
It is used to show the slope of data points in a chart. There are various types of trendlines, such as linear trendlines, exponential trendlines, and linear forecast trendlines.
Answer option B is incorrect. Excel provides a column chart facility to display data that is arranged in columns or rows on a worksheet. Line charts are used to display continuous data over time, set against a common scale. In a line chart, category data is distributed along the horizontal axis, and all value data is distributed along the vertical axis. Line charts are ideal for showing trends in data at equal intervals.
A line chart should be used where category labels are text, and are representing evenly spaced Values such as months, quarters, or years.
Question #12
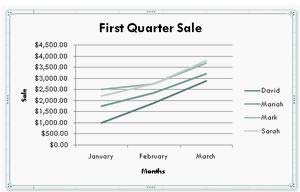
You work as a Sales Manager for Rainbow Inc. Your responsibility includes preparing sales report of the Sales department. You use Microsoft Excel 2010 to prepare sales reports. You have created a quarterly sales report of the department. After entering required data and inserting charts, you want to give a professional look to the document. You want to produce the document with soothing graphic effects, soft fonts, and light colors. Which of the following steps will you take to accomplish the task with least administrative burden?
- AUse the SmartArt option.
- BCreate a new workbook through a template. Copy all data and charts of the report to the new workbook.
- CChoose one of the pre-built themes.
- DSelect all the text of the document. Change font style to Verdana and font color to light gray. Use vibrant colors for charts.
Correct Answer:
C
In order to accomplish the task, you will have to choose one of the pre-built themes. Document themes work on the overall design of the entire document. It enables users to specify colors, fonts, and variety of graphic effects in a document. Themes change the look and feel of the document.
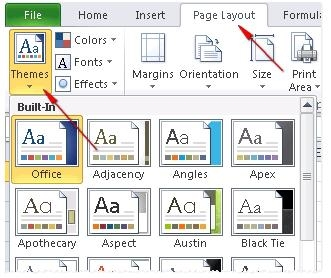
Microsoft Excel 2010 comes with a large collection of pre-built themes. Users can create their own themes for a document. Themes can be specified through Page
Layout > Themes.
Answer option A is incorrect. The SmartArt option does not produce soothing graphic effects, soft fonts, and light colors.
Answer options B and D are incorrect. These options involve manual processing. Therefore, any formatting done manually will increase the administrative burden.
C
In order to accomplish the task, you will have to choose one of the pre-built themes. Document themes work on the overall design of the entire document. It enables users to specify colors, fonts, and variety of graphic effects in a document. Themes change the look and feel of the document.
Microsoft Excel 2010 comes with a large collection of pre-built themes. Users can create their own themes for a document. Themes can be specified through Page
Layout > Themes.
Answer option A is incorrect. The SmartArt option does not produce soothing graphic effects, soft fonts, and light colors.
Answer options B and D are incorrect. These options involve manual processing. Therefore, any formatting done manually will increase the administrative burden.
Question #14
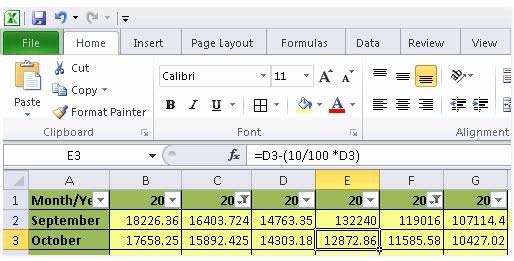
You work as an Office Assistant for Tech Perfect Inc. You are working in a spreadsheet as shown below:
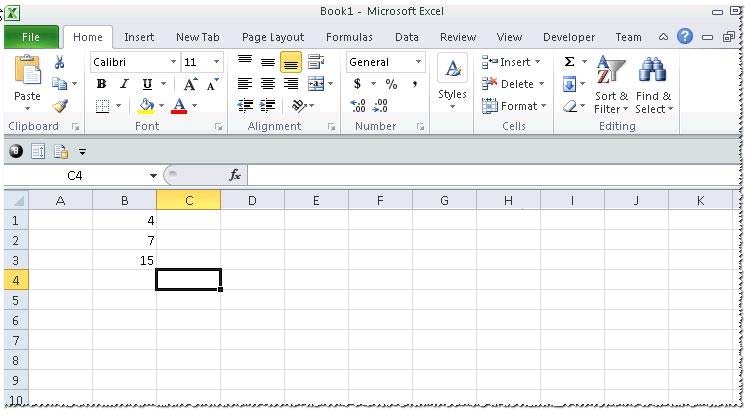
You want to use Excel Transpose Function for copying the contents of cells B1:B3 into cells A5:C5.
You simply type '=TRANSPOSE( B1:B3 )' into the cells A5:C5. It displays the Excel #VALUE! error message because the cells are working independently and the function will not work for each individual cell. Therefore, it is required to make the cells A5:C5 work together as an ARRAY. For this purpose, you are required to use an array formula. Which of the following steps will you take to input Excel array formulas in the spreadsheet?
Each correct answer represents a part of the solution. Choose all that apply.
Question #15
HOTSPOT -
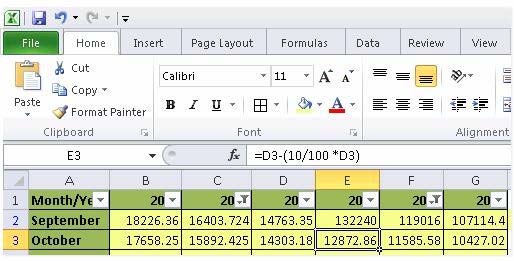
You work as a technician in Tech Perfect Inc. The Network Administrator of the company installs the Microsoft Excel 2010 application on the network. You open the application and see various changes in Excel 2010. You have to open an existing worksheet through the application. You are unable to find the Office button.
Mark the option that you will click to accomplish the task.
Hot Area:
Correct Answer:
You will have to click File button to accomplish the task. Clicking the File button will open the full- screen Backstage View of the sheet.
You will have to click File button to accomplish the task. Clicking the File button will open the full- screen Backstage View of the sheet.
All Pages