Microsoft 70-466 Exam Practice Questions (P. 5)
- Full Access (190 questions)
- One Year of Premium Access
- Access to one million comments
- Seamless ChatGPT Integration
- Ability to download PDF files
- Anki Flashcard files for revision
- No Captcha & No AdSense
- Advanced Exam Configuration
Question #21
You are designing a SQL Server Reporting Services (SSRS) report for a bank. The bank has Automated Teller Machines (ATMs) in several regions. ATM operational data is stored in a Microsoft Azure SQL Database database.
The report must use a map to display the location and status of the ATMs as shown in the following exhibit. (Click the Exhibit button.)
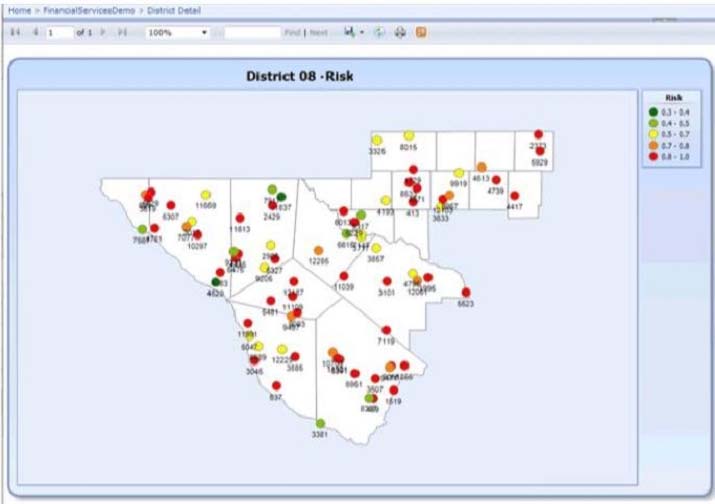
You need to ensure that the report displays only a user selected map region.
Which source of spatial data should you use for the map?
The report must use a map to display the location and status of the ATMs as shown in the following exhibit. (Click the Exhibit button.)
You need to ensure that the report displays only a user selected map region.
Which source of spatial data should you use for the map?
Question #22
You are developing a SQL Server Reporting Services (SSRS) report. The report includes a dataset with fields named Year Month Number, and InvCount. The report includes a table that displays the inventory count per year, as shown in the following table.
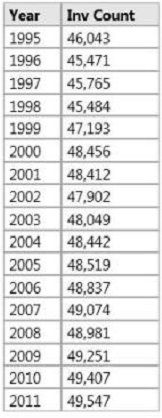
You need to modify the table to include a graphical item displaying the inventory count trend to the right of the Inv Count column.
What should you do?
You need to modify the table to include a graphical item displaying the inventory count trend to the right of the Inv Count column.
What should you do?
All Pages