QlikView QSBA2018 Exam Practice Questions (P. 3)
- Full Access (50 questions)
- Six months of Premium Access
- Access to one million comments
- Seamless ChatGPT Integration
- Ability to download PDF files
- Anki Flashcard files for revision
- No Captcha & No AdSense
- Advanced Exam Configuration
Question #11
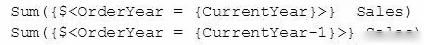
A business analyst must display current year sales versus previous year sales by region, sub-region, and city.
The result will be a pivot table, with rows for the region, sub-region, and city, and columns for Current Year Sales and Previous Year Sales.
Which calculated expressions should the business analyst create to meet these requirements?
A.

B.

C.

D.

The result will be a pivot table, with rows for the region, sub-region, and city, and columns for Current Year Sales and Previous Year Sales.
Which calculated expressions should the business analyst create to meet these requirements?
A.

B.

C.

D.

send
light_mode
delete
Question #12
A business analyst needs to create an app showing sales data. The app requirements are as follows:
✑ Compare sales for the current year (CY Sales) versus last year (LY Sales)
✑ CY Sales must always be displayed in blue
✑ LY Sales must always be displayed in yellow
Which steps should the business analyst take to meet these requirements?
✑ Compare sales for the current year (CY Sales) versus last year (LY Sales)
✑ CY Sales must always be displayed in blue
✑ LY Sales must always be displayed in yellow
Which steps should the business analyst take to meet these requirements?
- A1. Create a KPI with two measures, CY Sales and LY Sales 2. Write an IF expression to set the appropriate colors for each measure
- B1. Create CY Sales and LY Sales measures as master items 2. Write an IF expression to set the appropriate colors for the master items
- C1. Create CY Sales and LY Sales measures as master items and set the required color for each measure 2. Create one KPI from the two master item measuresMost Voted
- D1. Create CY Sales and LY Sales measures as master items and set the required color for each measure using Value colors 2. Create two gauges, one for each measure and set the color for each appropriately
Correct Answer:
B
B
send
light_mode
delete
Question #13
A business analyst is creating a dashboard to analyze supply chains. The app must contain several elements:
✑ A bar chart that shows a number of products and product groups handled by shipper
✑ A map that shows the number of shipments sent from factory locations
A bar chart that shows average delivery costs by shipper

Which dimensions should the business analyst use for this app?
✑ A bar chart that shows a number of products and product groups handled by shipper
✑ A map that shows the number of shipments sent from factory locations
A bar chart that shows average delivery costs by shipper

Which dimensions should the business analyst use for this app?
- AProduct, Shipper, FactoryLocation
- BShipper, FactoryLocationMost Voted
- CShipper, Product
- DProduct, ProductGroup, Shipper
Correct Answer:
D
D
send
light_mode
delete
Question #14
A business analyst uses the data manager to load customer data from a QVD file. The data manager automatically profiles the data, and recognizes City and
Country values as Geo data.
The app must meet the following requirements:
✑ Country field should be in Geo data format
✑ City should NOT be allowed as a mapping option for the users
✑ There must be an association between the Country and City fields
Which actions should the business analyst take to meet these requirements?
- A1. In the Associations view, select the City field 2. Delete $geoname-tag from field properties
- B1. In the Associations view, select the City field 2. Change the format from 'Geo data' to 'No data profiling'
- C1. In the Associations view, select the City field 2. Delete the City field
- D1. In the Associations view, select the City field 2. Change the format from 'Geo data' to 'General'Most Voted
Correct Answer:
D
D
send
light_mode
delete
Question #15

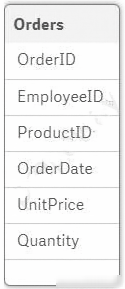
Refer to the exhibit.
A business analyst must analyze sales using an existing sales order app.
✑ The Orders table in the app was added from a QVD file using the data manager
✑ The Orders table in the app and the QVD do NOT contain a SalesAmount field
✑ SalesAmount can be calculated by multiplying the Quantity and UnitPrice
How should the business analyst add a SalesAmount field into the Orders table?
- AIn the data manager, create a new calculated field, SalesAmount, and set the expression value to Sum(UnitPrice * Quantity)
- BIn the data mode viewer, add a calculated field named SalesAmount with the expression UnitPrice * Quantity
- CIn the data manager, add a calculated field named SalesAmount with the expression UnitPrice * QuantityMost Voted
- DIn the Orders QVD file, add an additional field named SalesAmount with the expression UnitPrice * Quantity
Correct Answer:
C
C
send
light_mode
delete
All Pages