Microsoft DA-100 Exam Practice Questions (P. 3)
- Full Access (94 questions)
- One Year of Premium Access
- Access to one million comments
- Seamless ChatGPT Integration
- Ability to download PDF files
- Anki Flashcard files for revision
- No Captcha & No AdSense
- Advanced Exam Configuration
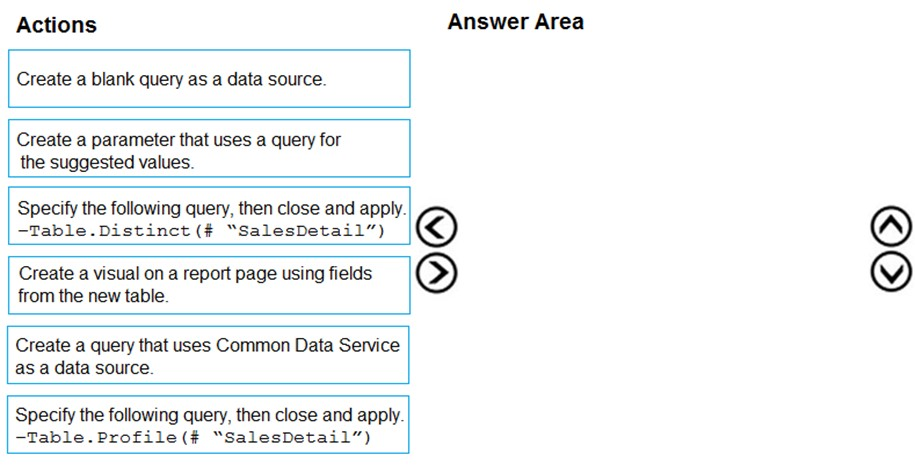
Question #14
DRAG DROP -
You are modeling data in a table named SalesDetail by using Microsoft Power BI.
You need to provide end users with access to the summary statistics about the SalesDetail data. The users require insights on the completeness of the data and the value distributions.
Which three actions should you perform in sequence? To answer, move the appropriate actions from the list of actions to the answer area and arrange them in the correct order,
Select and Place:
Correct Answer:
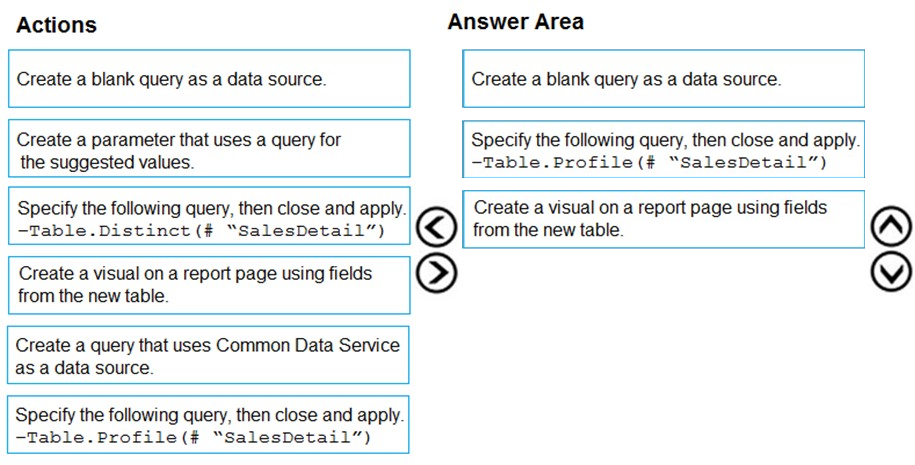
Step 1: Create a blank query as a data source
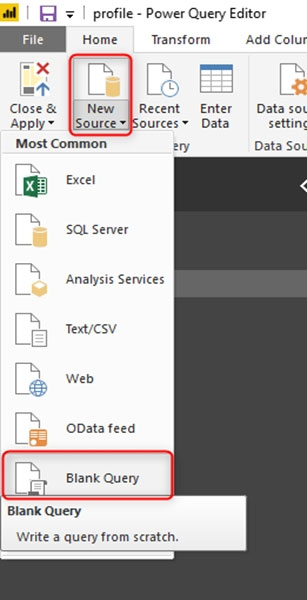
Start with a New Source in Power Query Editor, and then Blank Query.
Create a parameter that use a query for suggested values.
Step 2: Specify the following query, then close and apply. -Table.Profile(#ֲ¨SalesDetail")
In the new blank query, in the formula bar (if you don't see the formula bar, check the formula bar option in the View tab of the Power Query Editor), type below expression:
=Table.Profile()
Note that this code is not complete yet, we need to provide a table as the input of this function.
Note: The Table.Profile() function takes a value of type table and returns a table that displays, for each column in the original table, the minimum, maximum, average, standard deviation, count of values, count of null values and count of distinct values.
Step 3: Create a visual for the query table.
The profiling data that you get from Table.Profile function is like below;
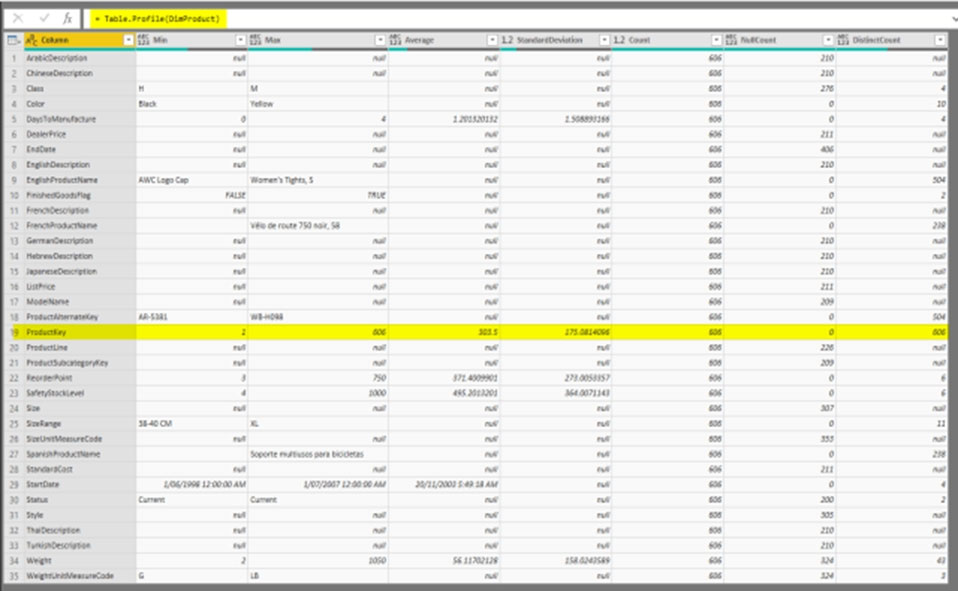
After loading the data into Power BI, you'll have the table with all columns, and it can be used in any visuals.
Reference:
https://radacad.com/create-a-profiling-report-in-power-bi-give-the-end-user-information-about-the-data
Step 1: Create a blank query as a data source
Start with a New Source in Power Query Editor, and then Blank Query.
Create a parameter that use a query for suggested values.
Step 2: Specify the following query, then close and apply. -Table.Profile(#ֲ¨SalesDetail")
In the new blank query, in the formula bar (if you don't see the formula bar, check the formula bar option in the View tab of the Power Query Editor), type below expression:
=Table.Profile()
Note that this code is not complete yet, we need to provide a table as the input of this function.
Note: The Table.Profile() function takes a value of type table and returns a table that displays, for each column in the original table, the minimum, maximum, average, standard deviation, count of values, count of null values and count of distinct values.
Step 3: Create a visual for the query table.
The profiling data that you get from Table.Profile function is like below;
After loading the data into Power BI, you'll have the table with all columns, and it can be used in any visuals.
Reference:
https://radacad.com/create-a-profiling-report-in-power-bi-give-the-end-user-information-about-the-data
Question #15
You create the following step by using Power Query Editor.
- Table.ReplaceValue(SalesLT_Address,"1318","1319",Replacer.ReplaceText,{"AddressLine1"})
A row has a value of 21318 Lasalle Street in the AddressLine1 column.
What will the value be when the step is applied?
- Table.ReplaceValue(SalesLT_Address,"1318","1319",Replacer.ReplaceText,{"AddressLine1"})
A row has a value of 21318 Lasalle Street in the AddressLine1 column.
What will the value be when the step is applied?
- A1318
- B1319
- C21318 Lasalle Street
- D21319 Lasalle Street
Correct Answer:
D
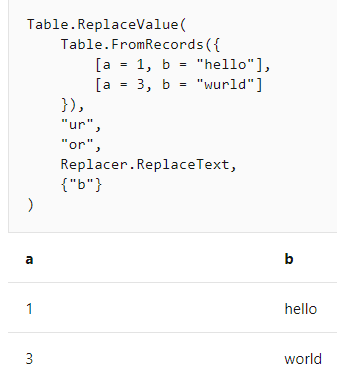
Example:
Replace the text "ur" with the text "or" in the table.
Reference:
https://docs.microsoft.com/en-us/powerquery-m/table-replacevalue
D
Example:
Replace the text "ur" with the text "or" in the table.
Reference:
https://docs.microsoft.com/en-us/powerquery-m/table-replacevalue
All Pages