Microsoft DA-100 Exam Practice Questions (P. 1)
- Full Access (94 questions)
- One Year of Premium Access
- Access to one million comments
- Seamless ChatGPT Integration
- Ability to download PDF files
- Anki Flashcard files for revision
- No Captcha & No AdSense
- Advanced Exam Configuration
Question #2
You have the tables shown in the following table.
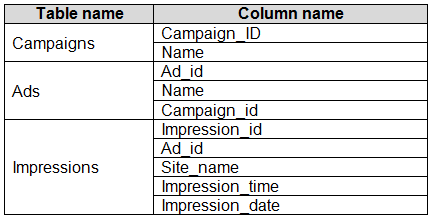
The Impressions table contains approximately 30 million records per month.
You need to create an ad analytics system to meet the following requirements:
✑ Present ad impression counts for the day, campaign, and Site_name. The analytics for the last year are required.
✑ Minimize the data model size.
Which two actions should you perform? Each correct answer presents part of the solution.
NOTE: Each correct selection is worth one point.
Question #5
You have a prospective customer list that contains 1,500 rows of data. The list contains the following fields:
✑ First name
✑ Last name
✑ Email address
✑ State/Region
✑ Phone number
You import the list into Power Query Editor.
You need to ensure that the list contains records for each State/Region to which you want to target a marketing campaign.
Which two actions should you perform? Each correct answer presents part of the solution.
NOTE: Each correct selection is worth one point.
- AOpen the Advanced Editor.
- BSelect Column quality.
- CEnable Column profiling based on entire dataset.
- DSelect Column distribution.
- ESelect Column profile.
Correct Answer:
DE
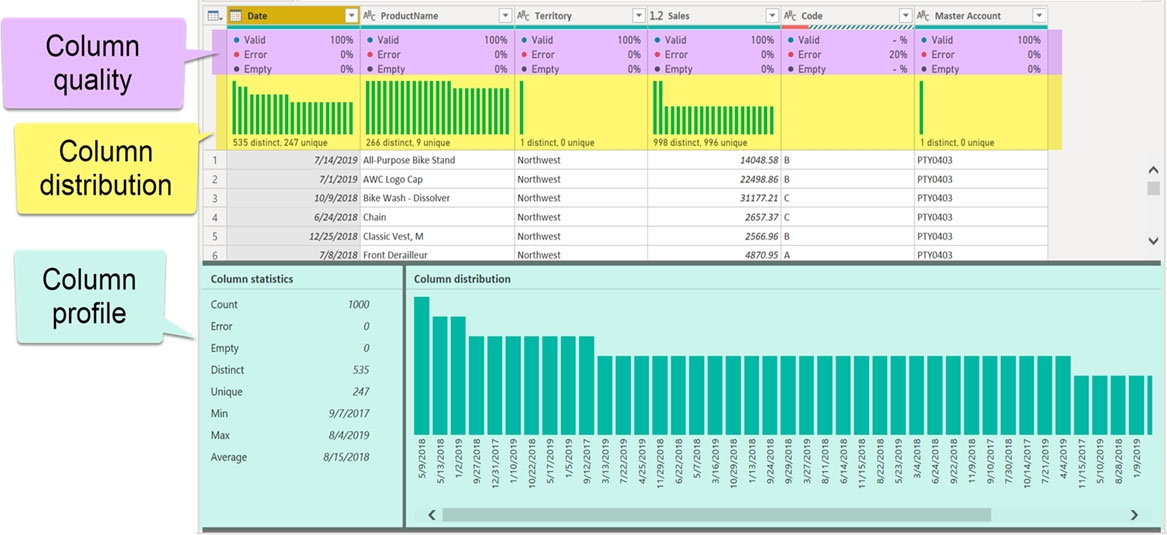
Data Profiling, Quality & Distribution in Power BI / Power Query features
To enable these features, you need to go to the View tab ֳ Data Preview Group ֳ Check the following:
✑ Column quality
✑ Column profile
✑ Column distribution
✑ Column profile
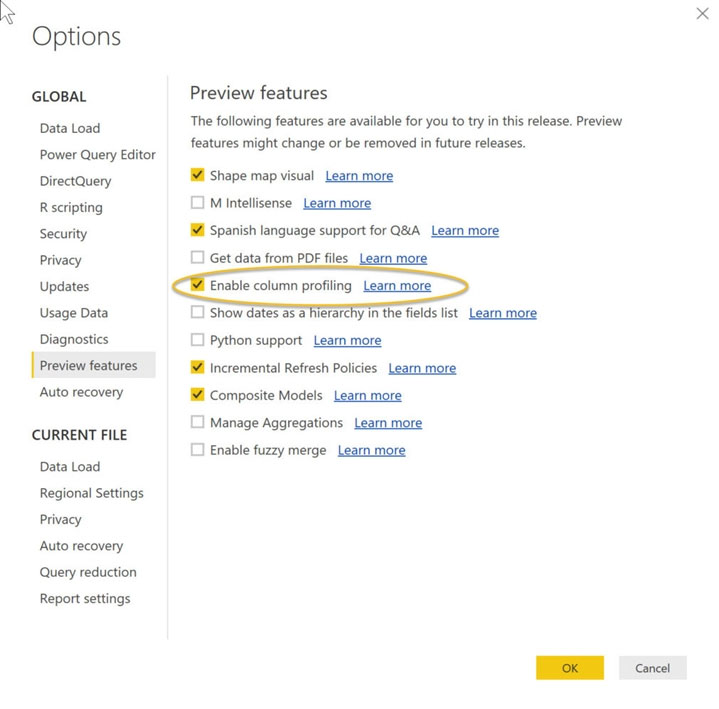
Turn on the Column Profiling feature.
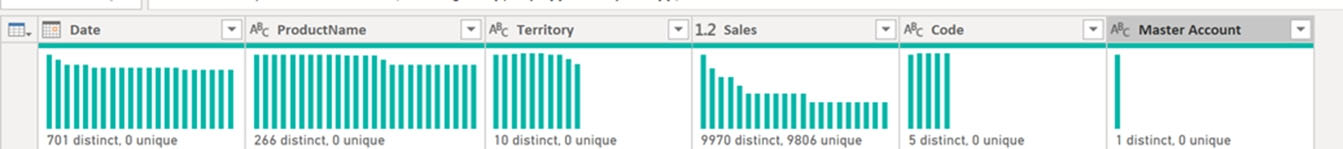
✑ Column distribution
Can use it to visually realize that your query is missing some data because of distinct and uniqueness counts.
Reference:
https://www.poweredsolutions.co/2019/08/13/data-profiling-quality-distribution-in-power-bi-power-query/ https://www.altentertraining.com/microsoft/power-bi/column-profiling-is-good/
DE
Data Profiling, Quality & Distribution in Power BI / Power Query features
To enable these features, you need to go to the View tab ֳ Data Preview Group ֳ Check the following:
✑ Column quality
✑ Column profile
✑ Column distribution
✑ Column profile
Turn on the Column Profiling feature.
✑ Column distribution
Can use it to visually realize that your query is missing some data because of distinct and uniqueness counts.
Reference:
https://www.poweredsolutions.co/2019/08/13/data-profiling-quality-distribution-in-power-bi-power-query/ https://www.altentertraining.com/microsoft/power-bi/column-profiling-is-good/
All Pages