Six Sigma ICBB Exam Practice Questions (P. 5)
- Full Access (324 questions)
- Six months of Premium Access
- Access to one million comments
- Seamless ChatGPT Integration
- Ability to download PDF files
- Anki Flashcard files for revision
- No Captcha & No AdSense
- Advanced Exam Configuration
Question #41
Which statement(s) are incorrect for the Regression Analysis shown here? (Note: There are 2 correct answers).
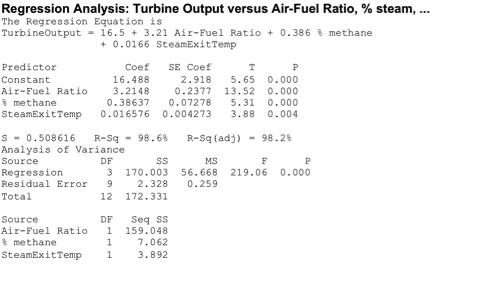

- AThe air-fuel ratio explains most of the TurbineOutput variation
- BThe Regression explains over 98% of the process variation
- CThis Multiple Linear Regression has three statistically significant independent variables
- DIf the air-fuel ratio increases by 1, the TurbineOutput more than triplesMost Voted
- EThe SteamExitTemp explains the most variation of the TurbineOutputMost Voted
Correct Answer:
DE
DE
send
light_mode
delete
Question #42
Which statement(s) are most correct for the Regression Analysis shown here?
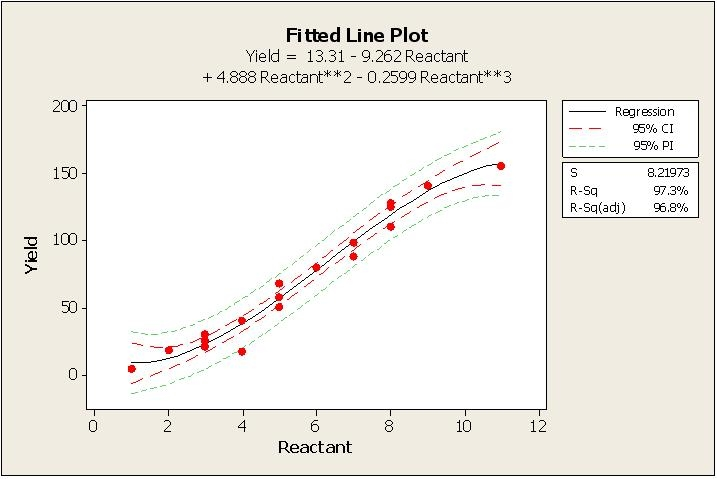

- AThe Regression explains 50.8% of the process variation
- BThe air-fuel ratio explains most of the TurbineOutput variationMost Voted
- CThis Simple Linear Regression explains 98+% of the process variation
- DThis Multiple Linear Regression has four statistically significant independent variables
Correct Answer:
B
B
send
light_mode
delete
Question #43
A valid mathematical Regression represents all of the characteristics shown except ___________________________.
- AThe residuals when plotted follow a Normal Distribution
- BThe sum of the residuals is zero
- CAll of the standardized residuals will be within ±3 Standard Deviations
- DMost standardized residuals are within ±2 Standard Deviations
Correct Answer:
C
C
send
light_mode
delete
Question #44
When a Belt conducts a Linear Correlation Analysis and finds that as an X increases the Y also increase then he has proven a ______________ correlation.
send
light_mode
delete
Question #45
A valid Multiple Linear Regression (MLR) is characterized by all of these except _______________________.
- AIt is an assumption that the X’s (inputs) are not correlated to each other
- BThe X’s (inputs) are assumed to be independent of each other
- CMLR is conducted based on a deliberate form of experimentation
- DThe Residuals from MLR analysis have to be Normally Distributed
Correct Answer:
C
C
send
light_mode
delete
Question #46
Which statement is NOT correct about the Fitted Line Plot shown here?
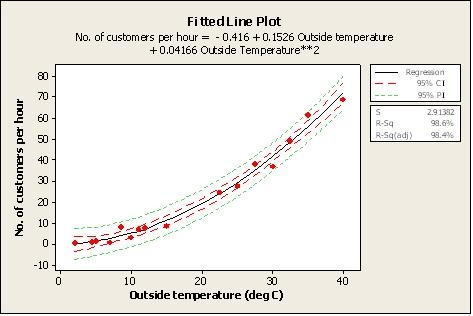

- AThe independent variable is the reactant
- BIf the reactant was 6 units, with 95 % confidence we would expect a minimum yield of 100 unitsMost Voted
- CWith at least 95% confidence, we can expect less than 10 units of Yield when the reactant is at a value of 1
- DA reactant value between 2 and 4 units yields around 20 to 40
- EWhen the reactant increases, the expected yield would increase
Correct Answer:
D
D
send
light_mode
delete
Question #47
When doing Hypothesis Testing on Non-normal data Belts will use a ________________ to compare more than two sample proportions to each other.
- AZ score Table
- BSakami Table
- CMean-to-Mode Analysis
- DContingency Table
Correct Answer:
C
C
send
light_mode
delete
Question #48
It would be more likely than not for a Belt conducting a Regression Analysis to find that the _______________________.
- Ar2 value is smaller than the absolute value of r
- BCorrelation Coefficient equals r2
- CCoefficient of Determination is less than r2
- DCorrelation Coefficient equals r divided by 2
Correct Answer:
A
A
send
light_mode
delete
Question #49
When a Belt properly analyzes the results of an experiment he must examine the Residuals in expectation of finding all of the following except _________.
- ASome Residuals higher than others
- BSome Residuals lower than others
- CAll Residuals within 2 Standard Deviations of the Mean
- DResiduals will represent a Linear Regression
Correct Answer:
D
D
send
light_mode
delete
Question #50
Which statement(s) are correct about the Regression shown here? (Note: There are 2 correct answers).


- AThe dependent variable is the outside temperature
- BThe relationship between outside temperature and number of customers per hour is a Linear Regression
- CThe dashed lines indicate with 95% confidence where all of the process data should fall between
- DThe dashed lines indicate with 95% confidence the estimate for the Quadratic Regression Line
- EThe predicted number of customers per hour is close to 5 if the outside temperature is 10 deg C
Correct Answer:
DE
DE
send
light_mode
delete
All Pages