Microsoft 70-467 Exam Practice Questions (P. 5)
- Full Access (102 questions)
- Six months of Premium Access
- Access to one million comments
- Seamless ChatGPT Integration
- Ability to download PDF files
- Anki Flashcard files for revision
- No Captcha & No AdSense
- Advanced Exam Configuration
Question #21
You are developing the database schema for a SQL Server Analysis Services (SSAS) BI Semantic Model (BISM). The BISM will be based on the schema displayed in the following graphic.
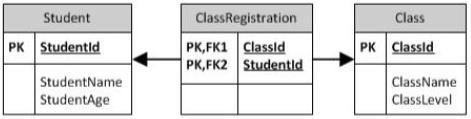
You have the following requirements:
✑ Ensure that queries of the data model correctly display average student age by class and average class level by student.
✑ Minimize development effort.
You need to design the data model.
What should you do? (More than one answer choice may achieve the goal. Select the BEST answer.)
Question #22
DRAG DROP -
You are designing a self-service business intelligence and reporting environment.
Business analysts will create and publish PowerPivot for Microsoft Excel workbooks and create reports by using SQL Server Reporting Services (SSRS) and
Power View. When the data models become more complex and the data volume increases, the data models will be replaced by IT-hosted server-based models.
You have the following requirements:
✑ Maintain the self-service nature of the reporting environment.
✑ Reuse existing reports.
✑ Add calculated columns to the data models.
You need to create a strategy for implementing this process.
What should you do?
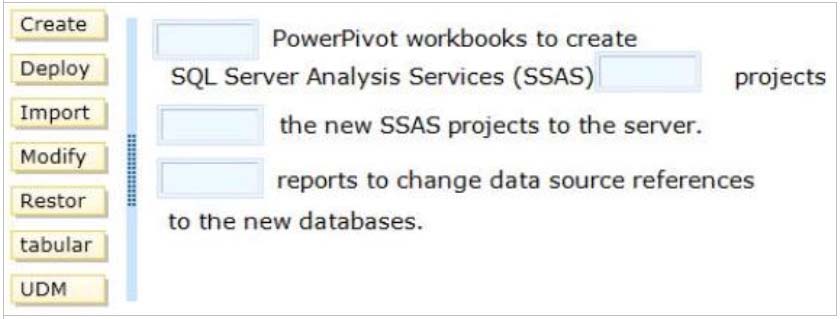
To answer, drag the appropriate term or terms to the correct location or locations in the answer area. (Answer choices may be used once, more than once, or not all.)
Select and Place:
You are designing a self-service business intelligence and reporting environment.
Business analysts will create and publish PowerPivot for Microsoft Excel workbooks and create reports by using SQL Server Reporting Services (SSRS) and
Power View. When the data models become more complex and the data volume increases, the data models will be replaced by IT-hosted server-based models.
You have the following requirements:
✑ Maintain the self-service nature of the reporting environment.
✑ Reuse existing reports.
✑ Add calculated columns to the data models.
You need to create a strategy for implementing this process.
What should you do?
To answer, drag the appropriate term or terms to the correct location or locations in the answer area. (Answer choices may be used once, more than once, or not all.)
Select and Place:
Correct Answer:
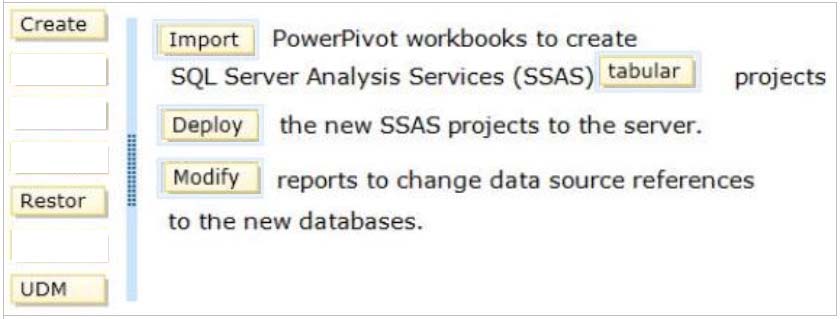
Box 1: Import -
Box 2: tabular -
Box 3: Deploy -
Box 4: Modify -
You can see that the audiences for these two approaches are different: Tabular models are for IT professionals, while PowerPivot models are for business users.
And keep in mind you can import a PowerPivot workbook to create a new tabular product. For example, a business user might create a solution using
PowerPivot. By restoring the workbook, IT can add features that are not supported in PowerPivot, such as roles to grant read permission to different groups of users. Additionally, recognition by IT that the model is important to the organization may prompt them to import the workbook into a tabular project and take ongoing responsibility for developing the model.
Question #24
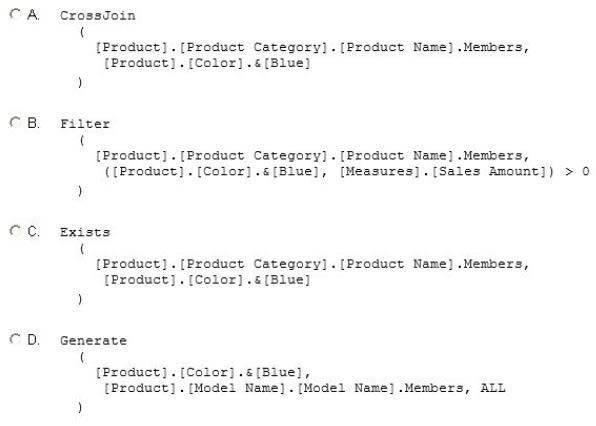
You are defining a named set by using Multidimensional Expressions (MDX) in a sales cube.
The cube includes a Product dimension that contains a Category hierarchy and a Color attribute hierarchy.
You need to return only the blue products in the Category hierarchy. Which set should you use? (More than one answer choice may achieve the goal. Select the
BEST answer.)
The cube includes a Product dimension that contains a Category hierarchy and a Color attribute hierarchy.
You need to return only the blue products in the Category hierarchy. Which set should you use? (More than one answer choice may achieve the goal. Select the
BEST answer.)
All Pages