Microsoft DP-900 Exam Practice Questions (P. 1)
- Full Access (325 questions)
- One Year of Premium Access
- Access to one million comments
- Seamless ChatGPT Integration
- Ability to download PDF files
- Anki Flashcard files for revision
- No Captcha & No AdSense
- Advanced Exam Configuration
Question #1
HOTSPOT -
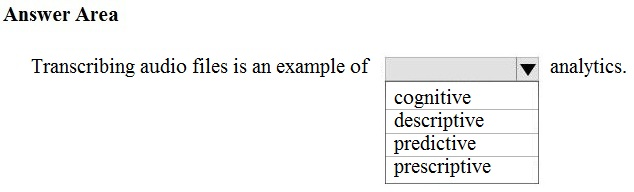
To complete the sentence, select the appropriate option in the answer area.
Hot Area:
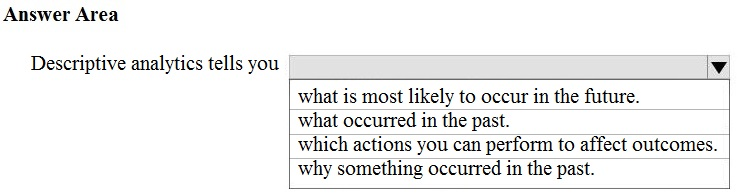
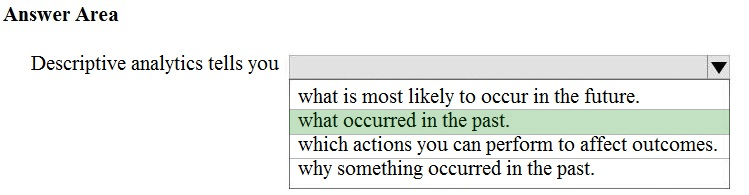
To complete the sentence, select the appropriate option in the answer area.
Hot Area:
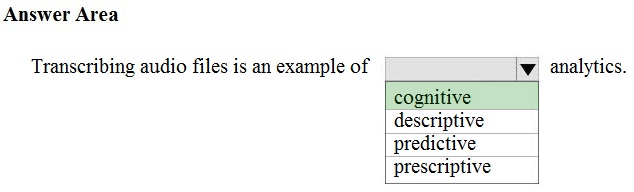
Correct Answer:
Reference:
https://demand-planning.com/2020/01/20/the-differences-between-descriptive-diagnostic-predictive-cognitive-analytics/
Reference:
https://demand-planning.com/2020/01/20/the-differences-between-descriptive-diagnostic-predictive-cognitive-analytics/
Question #2
HOTSPOT -
For each of the following statements, select Yes if the statement is true. Otherwise, select No.
NOTE: Each correct selection is worth one point.
Hot Area:
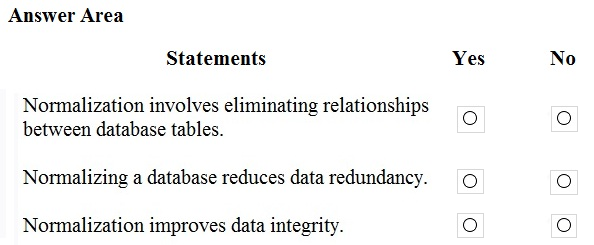
For each of the following statements, select Yes if the statement is true. Otherwise, select No.
NOTE: Each correct selection is worth one point.
Hot Area:
Correct Answer:
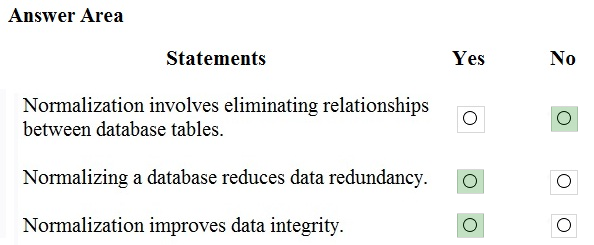
Reference:
https://www.sqlshack.com/what-is-database-normalization-in-sql-server/
Reference:
https://www.sqlshack.com/what-is-database-normalization-in-sql-server/
Question #3
HOTSPOT -
To complete the sentence, select the appropriate option in the answer area.
Hot Area:
To complete the sentence, select the appropriate option in the answer area.
Hot Area:
Correct Answer:
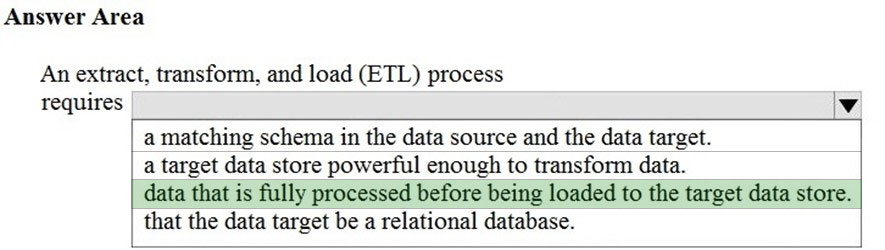
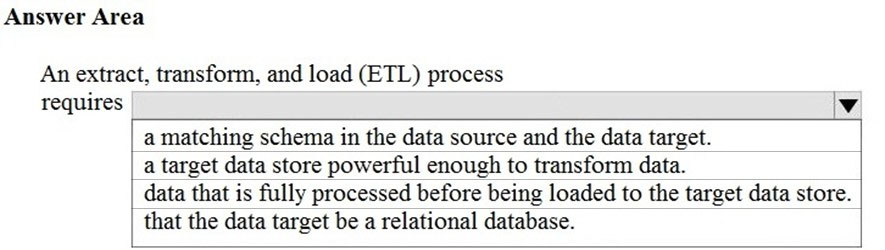
Extract, transform, and load (ETL) is a data pipeline used to collect data from various sources, transform the data according to business rules, and load it into a destination data store.
Reference:
https://docs.microsoft.com/en-us/azure/architecture/data-guide/relational-data/etl
Extract, transform, and load (ETL) is a data pipeline used to collect data from various sources, transform the data according to business rules, and load it into a destination data store.
Reference:
https://docs.microsoft.com/en-us/azure/architecture/data-guide/relational-data/etl
Question #4
HOTSPOT -
To complete the sentence, select the appropriate option in the answer area.
Hot Area:
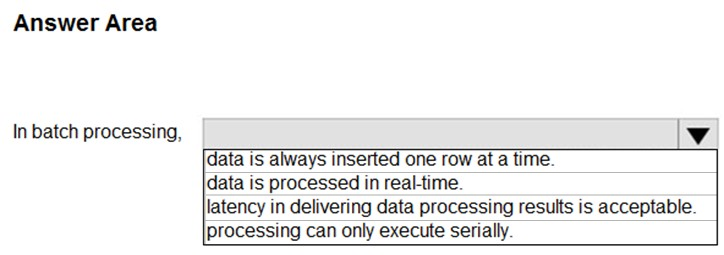
To complete the sentence, select the appropriate option in the answer area.
Hot Area:
Correct Answer:
When to use batch processing.
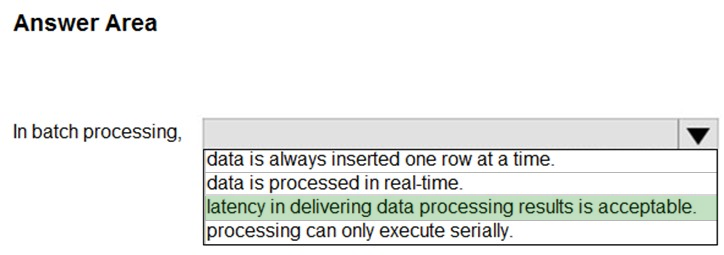
You might expect latencies when using batch processing. For many situations, however, this type of delay before the transfer of data begins is not a big issue - the processes that use this function are not mission critical at the exact moment.
Reference:
https://www.bmc.com/blogs/what-is-batch-processing-batch-processing-explained/
When to use batch processing.
You might expect latencies when using batch processing. For many situations, however, this type of delay before the transfer of data begins is not a big issue - the processes that use this function are not mission critical at the exact moment.
Reference:
https://www.bmc.com/blogs/what-is-batch-processing-batch-processing-explained/
Question #5
HOTSPOT -
To complete the sentence, select the appropriate option in the answer area.
Hot Area:
To complete the sentence, select the appropriate option in the answer area.
Hot Area:
Correct Answer:
Reference:
https://azure.microsoft.com/en-us/services/cognitive-services/speech-services/
Reference:
https://azure.microsoft.com/en-us/services/cognitive-services/speech-services/
Question #6
DRAG DROP -
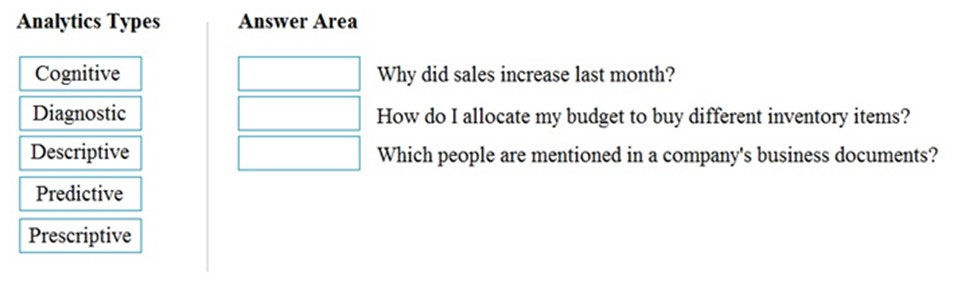
Match the types of analytics that can be used to answer the business questions.
To answer, drag the appropriate analytics type from the column on the left to its question on the right. Each analytics type may be used once, more than once, or not at all.
NOTE: Each correct match is worth one point.
Select and Place:
Correct Answer:
Incorrect Answer:
Box 1: Diagnostic -
Diagnostic Analytics: At this stage you can begin to answer some of those why questions. Historical data can begin to be measured against other data to answer the question of why something happened in the past. This is the process of gathering and interpreting different data sets to identify anomalies, detect patters, and determine relationships.
Box 2: Prescriptive -
Prescriptive analytics is a combination of data, mathematical models, and various business rules to infer actions to influence future desired outcomes.
Predictive analytics, broadly speaking, is a category of business intelligence that uses descriptive and predictive variables from the past to analyze and identify the likelihood of an unknown future outcome
Box 3: Descriptive -
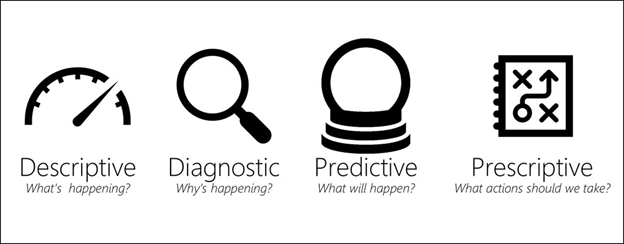
✑ Generally speaking, data analytics comes in four types:
✑ Descriptive, to answer the question: What's happening?
✑ Diagnostic, to answer the question: Why's happening?
✑ Predictive, to answer the question: What will happen?
✑ Prescriptive, to answer the question: What actions should we take?
Reference:
https://demand-planning.com/2020/01/20/the-differences-between-descriptive-diagnostic-predictive-cognitive-analytics/ https://azure.microsoft.com/en-us/blog/answering-whats-happening-whys-happening-and-what-will-happen-with-iot-analytics/
Incorrect Answer:
Box 1: Diagnostic -
Diagnostic Analytics: At this stage you can begin to answer some of those why questions. Historical data can begin to be measured against other data to answer the question of why something happened in the past. This is the process of gathering and interpreting different data sets to identify anomalies, detect patters, and determine relationships.
Box 2: Prescriptive -
Prescriptive analytics is a combination of data, mathematical models, and various business rules to infer actions to influence future desired outcomes.
Predictive analytics, broadly speaking, is a category of business intelligence that uses descriptive and predictive variables from the past to analyze and identify the likelihood of an unknown future outcome
Box 3: Descriptive -
✑ Generally speaking, data analytics comes in four types:
✑ Descriptive, to answer the question: What's happening?
✑ Diagnostic, to answer the question: Why's happening?
✑ Predictive, to answer the question: What will happen?
✑ Prescriptive, to answer the question: What actions should we take?
Reference:
https://demand-planning.com/2020/01/20/the-differences-between-descriptive-diagnostic-predictive-cognitive-analytics/ https://azure.microsoft.com/en-us/blog/answering-whats-happening-whys-happening-and-what-will-happen-with-iot-analytics/
Question #7
HOTSPOT -
You have the following JSON document.
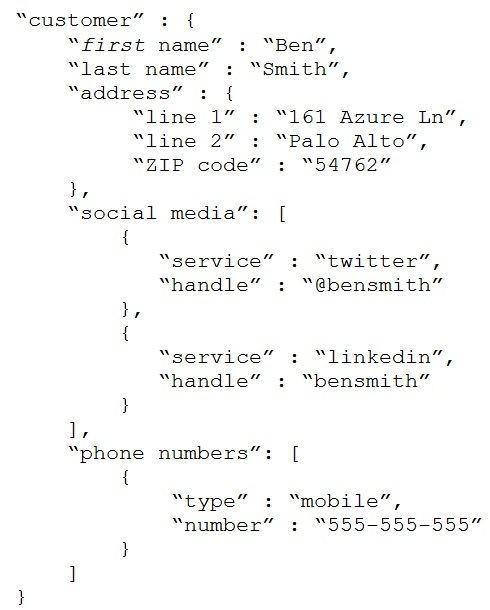
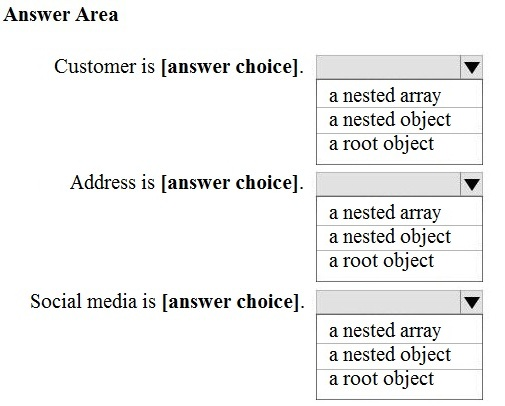
Use the drop-down menus to select the answer choice that completes each statement based on the information presented in the JSON document.
NOTE: Each correct selection is worth one point.
Hot Area:
You have the following JSON document.
Use the drop-down menus to select the answer choice that completes each statement based on the information presented in the JSON document.
NOTE: Each correct selection is worth one point.
Hot Area:
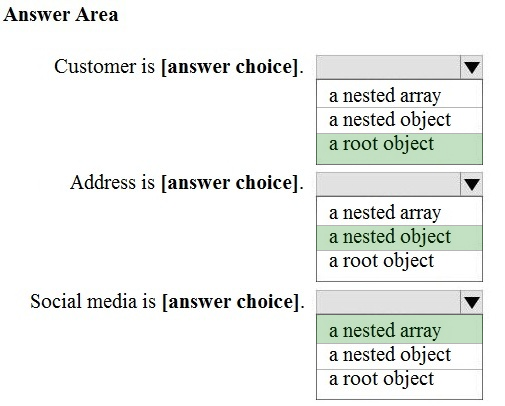
Correct Answer:
Reference:
https://www.w3schools.com/js/js_json_arrays.asp
https://www.w3schools.com/js/js_json_objects.asp
Reference:
https://www.w3schools.com/js/js_json_arrays.asp
https://www.w3schools.com/js/js_json_objects.asp
Question #8
HOTSPOT -
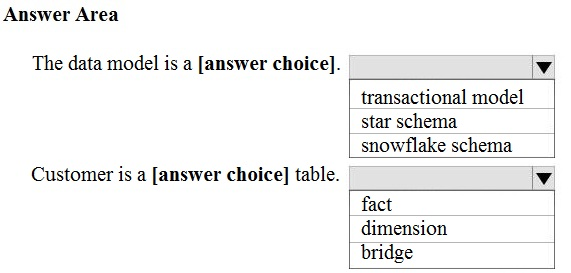
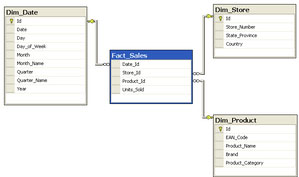
You are reviewing the data model shown in the following exhibit.
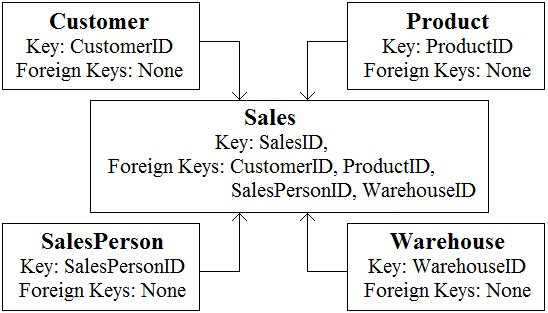
Use the drop-down menus to select the answer choice that completes each statement based on the information presented in the graphic.
NOTE: Each correct selection is worth one point
Hot Area:
You are reviewing the data model shown in the following exhibit.
Use the drop-down menus to select the answer choice that completes each statement based on the information presented in the graphic.
NOTE: Each correct selection is worth one point
Hot Area:
Correct Answer:
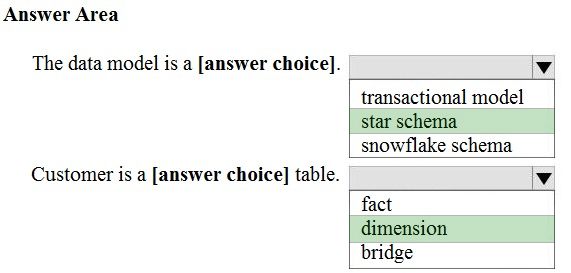
Box 1: star schema -
In computing, the star schema is the simplest style of data mart schema and is the approach most widely used to develop data warehouses and dimensional data marts. The star schema consists of one or more fact tables referencing any number of dimension tables. The star schema is an important special case of the snowflake schema, and is more effective for handling simpler queries.
Example:
Incorrect Answers:
The data in the question is not normalized.
The snowflake schema is a variation of the star schema, featuring normalization of dimension tables. Example:
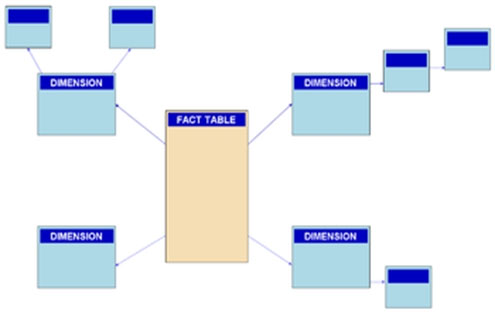
Note: A snowflake schema is a logical arrangement of tables in a multidimensional database such that the entity relationship diagram resembles a snowflake shape. The snowflake schema is represented by centralized fact tables which are connected to multiple dimensions.[citation needed]. "Snowflaking" is a method of normalizing the dimension tables in a star schema. When it is completely normalized along all the dimension tables, the resultant structure resembles a snowflake with the fact table in the middle.
Box 2: dimension -
The star schema consists of one or more fact tables referencing any number of dimension tables.
Reference:
https://docs.microsoft.com/en-us/azure/synapse-analytics/sql-data-warehouse/sql-data-warehouse-tables-overview https://en.wikipedia.org/wiki/Star_schema https://en.wikipedia.org/wiki/Snowflake_schema https://azure.microsoft.com/en-us/blog/data-models-within-azure-analysis-services-and-power-bi/
Box 1: star schema -
In computing, the star schema is the simplest style of data mart schema and is the approach most widely used to develop data warehouses and dimensional data marts. The star schema consists of one or more fact tables referencing any number of dimension tables. The star schema is an important special case of the snowflake schema, and is more effective for handling simpler queries.
Example:
Incorrect Answers:
The data in the question is not normalized.
The snowflake schema is a variation of the star schema, featuring normalization of dimension tables. Example:
Note: A snowflake schema is a logical arrangement of tables in a multidimensional database such that the entity relationship diagram resembles a snowflake shape. The snowflake schema is represented by centralized fact tables which are connected to multiple dimensions.[citation needed]. "Snowflaking" is a method of normalizing the dimension tables in a star schema. When it is completely normalized along all the dimension tables, the resultant structure resembles a snowflake with the fact table in the middle.
Box 2: dimension -
The star schema consists of one or more fact tables referencing any number of dimension tables.
Reference:
https://docs.microsoft.com/en-us/azure/synapse-analytics/sql-data-warehouse/sql-data-warehouse-tables-overview https://en.wikipedia.org/wiki/Star_schema https://en.wikipedia.org/wiki/Snowflake_schema https://azure.microsoft.com/en-us/blog/data-models-within-azure-analysis-services-and-power-bi/
Question #9
HOTSPOT -
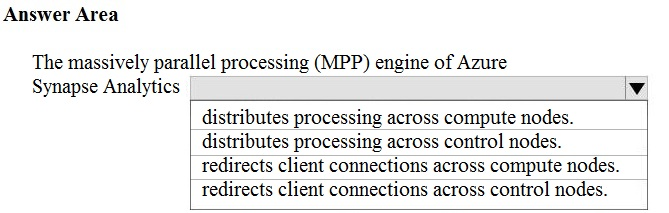
To complete the sentence, select the appropriate option in the answer area.
Hot Area:
To complete the sentence, select the appropriate option in the answer area.
Hot Area:
Correct Answer:
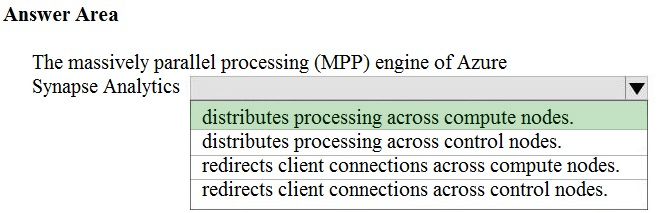
Reference:
https://docs.microsoft.com/en-us/azure/synapse-analytics/sql-data-warehouse/massively-parallel-processing-mpp-architecture
Reference:
https://docs.microsoft.com/en-us/azure/synapse-analytics/sql-data-warehouse/massively-parallel-processing-mpp-architecture
Question #10
HOTSPOT -
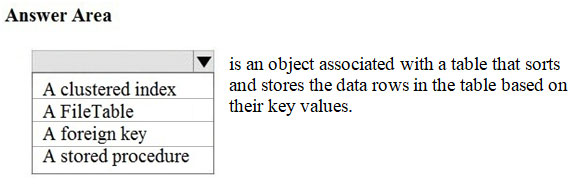
To complete the sentence, select the appropriate option in the answer area.
Hot Area:
To complete the sentence, select the appropriate option in the answer area.
Hot Area:
Correct Answer:
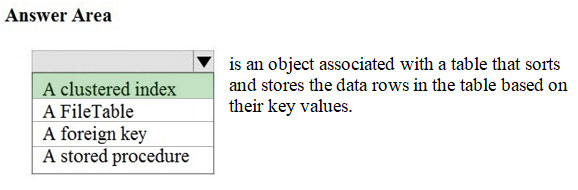
Reference:
https://docs.microsoft.com/en-us/sql/relational-databases/indexes/clustered-and-nonclustered-indexes-described?view=sql-server-ver15
Reference:
https://docs.microsoft.com/en-us/sql/relational-databases/indexes/clustered-and-nonclustered-indexes-described?view=sql-server-ver15
All Pages